Echo cancellation is a cornerstone of the audio experience in WebRTC. Google has invested quite a bit in this area, first with the delay-agnostic echo cancellation in 2015 and now with a new echo cancellation system called AEC3. Debugging issues related to AEC3 is one of the hardest areas. Al Brooks from NewVoiceMedia ran into a case of seriously degraded audio reported from his customers’ contact center agents. After a lengthy investigation it turned out to be caused by a Chrome experiment that enabled the new AEC3 for a percentage of users in Chrome stable.
Al takes us through a recap of how he analyzed the problem and narrowed it down enough to file a bug with the WebRTC team at Google.
{“editor”: “Philipp Hancke“}

The Issue
A number of customers reported experiencing heavily degraded audio on the agent egress audio stream on Oct 24th 2018. This is a multiple call leg scenario where callers from the PSTN are calling into a WebRTC-based contact center agent. Essentially the customers of my customers were stating they could not understand the agent speaking.
TL;DR
Google released the “experimental but stable” echo cancellation feature (AEC3) into the Stable version of Chrome 69. A select few were lucky enough to have this feature enabled for testing by Google. Symptoms only appeared if they fit a certain set of criteria: Windows OS, Chrome Browser, WebRTC and very specific headsets that pulse audio in chunks exceeding 104ms. Unfortunately, this testing of the AEC3 feature ended up causing some wide scale issues for my customer base.
Background
A typical scenario involves calls entering from the PSTN (Customer Leg) through an inbound number holder. The call passes through to our platform via SIP and waits while run through the customer’s configuration of intelligent applets to determine the call path. Multiple call legs may be created across a variety of carrier partners and bridged together. All of this before we even reach out to an agent. If that agent is on our WebRTC offering, we pass a call over to Twilio who handles the gateway conversion down to the WebRTC agents.

Initial Triage
After the initial reports, we went through our typical troubleshooting triage process. We requested some examples from our customers and enabled RTP tracing at both Twilio and our platform.
Audio captures showed audio degradation from the agent in systematic intervals that created a “helicopter” or fan-like noise. However, the metrics from the Twilio server and my customers WebRTC internal pages were all clean – no packet loss, jitter or excessive latency…
The biggest problem we originally encountered was filtering out unrelated issues to the current incident. That and the inability to reproduce the issue ourselves across multiple environments and configurations. We started looking for commonalities across operating system versions, release updates, browsers, hardware, driver versions… Ultimately, we had too many variables to really reduce the scope of the issue. At this point, we knew it was not your typical WebRTC local network congestion and something was really broken on a wider scale.
In-Depth Analysis
After sorting through the high number of false-positive examples, I took a step back to try to redefine the core issue and isolate the “signature” that defines the incident. Common factors were:
- Windows OS
- Chrome Browser
- Headset usage
- Systematic audio choppiness on the agent egress
Listen here for a sample showing helicopter-like sound from a test example (Low volume warning, beware of sound cloud auto-play!).
I started comparing the audio examples that we received downstream at my platform against each other. They sounded similar, so I started running comparisons in Audacity to see a visual of the audio waves.

The visual above shows the peaks of audio with time separation. Timescale across the top is in seconds but was still noticeable zoomed out. There was a difference between the way I expected the audio wave to look and the one I was seeing. Specifically that the audio was not one fluid wave throughout the word being captured. But instead chopped into small audio bites with complete silence between. We used this as a way to qualify examples that were submitted by our customers to associate into the ongoing incident. We looked for that distinct sound then verified the audio was broken into these smaller pieces while still maintaining clean metrics.

I zoomed in on the break in audio from the previous image to measure the loss of RTP. This was ~100ms consistently across all customers reporting using Jabra headsets. Minor variance due to where I selected with my mouse. Sennheiser headsets also systematically lost around ~64ms. It was interesting to see and started to lead me down the path of something either overflowing or buffering. Potentially exceeding some level max level of processing.
Our first thought was Chrome or Windows was throttling out on resources, but without seeing it first hand or being able to replicate, this was proving immensely difficult.
On-site Visit
At this point, it was November 12th – 19 days later. We were able to work with a specific customer onsite to conduct a full analysis. Replication was the goal. Thankfully it was an immediate success using my own laptop but with the customer’s headset. I tested outside of the customer network (Cellular Hotspot) and verified the issue was still occurring to remove the local network from the equation.
I went through every commonality possible capturing everything I could to start identifying trends.
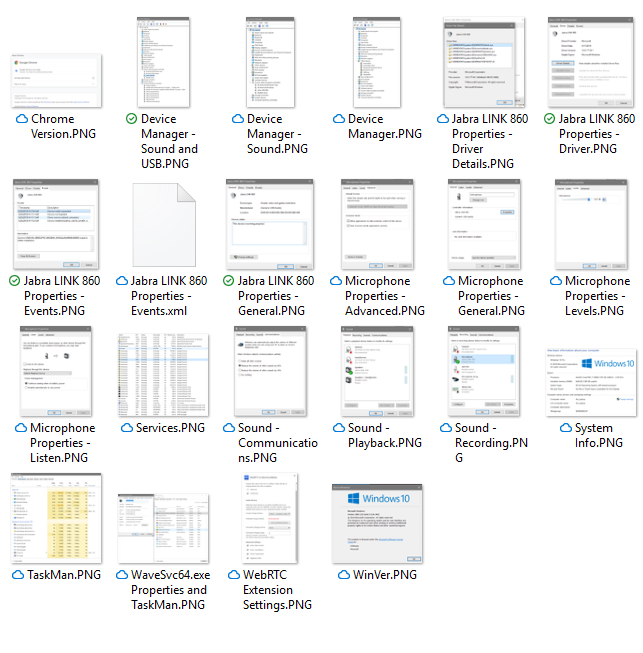
With some configuration data captured, time to dig in for a baseline reference. I was able to replicate the issue 100% of the time using a Jabra BIZ with QD connected to ENA0003 DSP USB to my Dell Latitude E7450. Baseline examples showed the same audio issue with a consistent ~100ms loss.
I captured Chrome Console logs, chrome://webrtc-internals, local PCAP, downstream PCAP and even started recording with Windows built-in Voice Recorder to see at what point the audio started being degraded.
Below is a comparison of the local recording captured by the Voice Recorder in the OS vs. the audio file captured downstream as it crosses our platform. Notice the same ~100ms gap although with slight noise on this specific example.
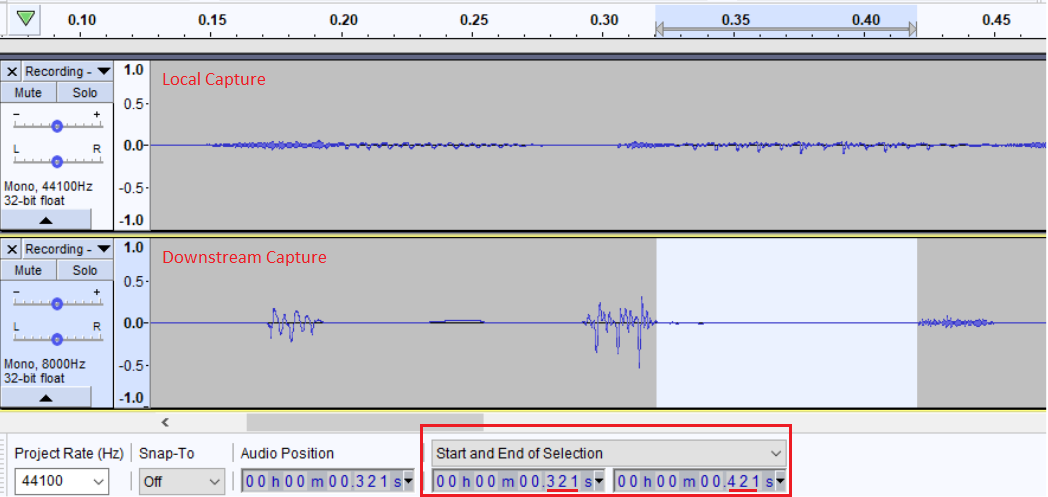
These findings allowed us to reduce the scope further. The audio is clean coming from the headset and into the OS/Voice Recorder application. PCAPs were not much help since we couldn’t decrypt the SRTP. We were able to capture the degraded audio as it crossed the WebRTC gateway, which is as close to the client source as we were able to get at this point in time. In addition, we started gathering diagnostic audio which mirrored these findings.
I played with the theory of the headsets capturing at 16kHz and needing to be downsized to 8kHz for PCMU codec. Ultimately that didn’t seem to go anywhere and I never needed to revisit it.
OK. Reality check. Something is happening between Chrome and the WebRTC Gateway. If we can’t extract audio mid-stream, we will have to follow the metrics. But the metrics in WebRTC Internals from basic triage showed no packet loss or jitter… Meaning the audio was broken before transmitting any network. So… Something must be occurring within the browser or OS to cause this degradation!
Misc. Tests to Reduce Scope
Let’s try Firefox.
Outcome: Unable to replicate using the same headset as before with no changes on the PC.
We have again further reduced the scope to only Windows machines reporting and Chrome browser. Next call made on Chrome replicated the issue right after Firefox audio was clear… Starting to get closer to a root cause.
What about the built-in constraints of WebRTC? We have them baked into our advanced options on the WebRTC extension for our product. Results were inconsistent.
Outcome: No combination of Auto Gain Control (AGC), Echo Cancellation, Noise Suppression or Highpass Filter seemed to have any conclusive positive results.
At some point, Windows forced my hand to run an update. And when I went to confirm my Chrome version via the About Chrome button, it had also updated to a newer version of Chrome 70. Thankfully (or not thankfully) I was still able to reproduce the issue after both those changes to my test machine.
Down the Rabbit Hole
Now with a firm belief that there is something going on within Chrome that is causing this, I did what everyone troubleshooting does – have a couple of beers and start yelling at random peripherals! Then after composing myself, went online to look for anything and everything built into Chrome to diagnose issues. My data points per replication continued to grow.
As I added new bits of capturing from chrome://webrtc-internals Diagnostic Audio recordings, Chrome Performance Monitor, WebRTC Logs, Chrome Task Manager and even Chrome Tracing, I was still not able to see anything pointing to a specific root cause. Checked out the system logs in Windows as well. Just searching for events occurring within ~100ms or reoccurring intervals. Nothing for either Performance Monitor or Internals caught my eye. But it does look cool!
Back to Basics
I’ll be the first to admit, this level of browser processing is over my head. I only play a geek on tv. I decided to go back and re-examine what I do have experience with, and that is chrome://webrtc-internals. I had noticed a trend earlier in examples vs baselines that the examples with replication had a serious fluctuation with the Jitter Buffer. It looked strange, so I investigated further.
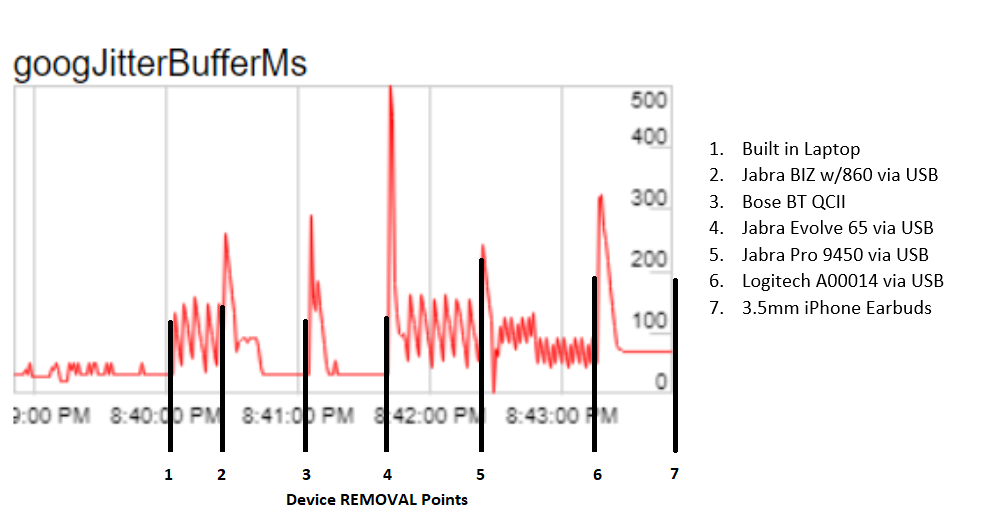
I pulled some old internals logs from days/weeks/months before the incident and saw that typically the Jitter Buffer is smooth in nature and increases when Jitter is present. However, we saw massive variations on affected calls with spikes upwards of 200ms. It was sawing up and down without any corresponding Jitter to warrant the rise.

At some point in utter frustration, I knocked the USB cable out of my laptop mid-call. I happened to have WebRTC Internals open and noticed the Jitter Buffer graph flattening when the device was disconnected. Back to the headsets… Great!
I started to mess around with the Windows Sounds settings. I noticed that muting the mic or speakers had no effect on the Jitter Buffer. However, when I disabled the device, similar to unplugging it, the Jitter Buffer flattened… So it wasn’t feedback from the headset or USB noise introduced into the computer. But I had nothing conclusive. Interestingly useless data point. Then I decided to play mad scientist.
R.I.P. My USB Port
I decided to take the known headsets that can reproduce the issue and start hot swapping mid-call. I found some interesting results. Essentially the headsets my customers specifically told me were problematic showed the same fluctuation within the Jitter Buffer. I did a blind test with my customer to confirm which headsets were reportedly problematic, and sure enough, we had a match.
You can see below that the built-in laptop speaker/mic has some minor fluctuations. But when we plugged in certain headsets, and after the initial spike of changing device, the Jitter Buffer would either jump 150+ms consistently or calm down and settle to the preferred 20ms. Wild! Now we have a visual on something occurring within the browser. Our first metric reference point!
Outside of our SDK, Service Provider, and Product
I have GoogleFi as my cellular provider. Fi uses WebRTC with the Opus codec when leveraging hangouts on my PC for calls. I gave it a try with a colleague, which started just fine. Then I decided to pull my headset, and sure enough when I plugged back in the audio choppiness became apparent, the Jitter Buffer spiked wildly, and we now have a confirmed example OUTSIDE of anything involving my company. Huzzah, it isn’t just us! But, why can’t I find anyone else having issues online? I was happy that my product isn’t broken alone… But how do we fix it to alleviate my customer issues?
At this point Twilio jumped all over this new finding (Thanks Twils!) and opened a bug case with Google. I believe they also escalated to some point of contact to wrap some urgency around the issue.
Still Gathering Data. WebRTC Debug Mode
I was not convinced we had a solid enough data set to explain what in the hell was going on, so I continued to dig further. At some point, I stumbled across some startup variables that would allow Chrome to enter a verbose logging mode specifically for WebRTC bug tracking. What a find it is!
This mode forces every single instruction or function around WebRTC within the browser to output verbose to a debug log file. Or at least that was my take on it. Here is where it gets interesting….
The log shows the entire lifecycle of a call. The sample below was from my hotel room. Although on Wi-Fi, the signature is an exact match, so we can ignore the basic potential for quality issues. It goes through initial setup, STUN connectivity, codec agreements, etc.
Where it gets good from my perspective is when we start seeing specific references to audio issues and forcing a delay. That delay likely caused the Jitter Buffer to expand dramatically when a problematic headset is plugged in. Or the Jitter Buffer expansion is a byproduct of something with this audio delay. I’m learning this as I go along here…
Starting on line 334:
|
1 2 3 4 5 6 |
[6336:12940:1113/203204.078:WARNING:media_stream_audio_processor.cc(756)] Large audio delay, capture delay: 0ms; render delay: 390ms [6336:12940:1113/203204.078:WARNING:render_delay_buffer.cc(387)] Receiving a first reported externally buffer delay of 390 ms. [6336:12940:1113/203204.079:WARNING:render_delay_buffer.cc(420)] Applying internal delay of 97 blocks. [6336:12940:1113/203204.079:WARNING:render_delay_buffer.cc(310)] New max number api jitter observed at capture block 1: 2 blocks [6336:12940:1113/203204.079:WARNING:render_delay_buffer.cc(310)] New max number api jitter observed at capture block 2: 3 blocks [6336:12940:1113/203204.088:WARNING:media_stream_audio_processor.cc(756)] Large audio delay, capture delay: 10ms; render delay: 390ms |
And this starting 452:
|
1 2 3 4 5 6 |
[6336:12940:1113/203204.468:WARNING:render_delay_buffer.cc(420)] Applying internal delay of 98 blocks. [6336:12940:1113/203204.468:WARNING:block_processor.cc(153)] Reset due to render buffer api skew at block 98 [6336:12940:1113/203204.478:WARNING:render_delay_buffer.cc(262)] New max number api jitter observed at render block 195: 33 blocks [6336:12940:1113/203204.478:WARNING:render_delay_buffer.cc(420)] Applying internal delay of 96 blocks. [6336:12940:1113/203204.579:WARNING:render_delay_buffer.cc(420)] Applying internal delay of 96 blocks. [6336:12940:1113/203204.579:WARNING:block_processor.cc(153)] Reset due to render buffer api skew at block 126 |
Troubleshooting Steps Organized
Here is a breakdown of the steps involved to get from start to finish. This was all conducted by me personally. While we had a number of resources from different companies and departments reviewing things and testing independently… If I didn’t do it personally, it’s not on the list to keep things clear and concise.
Looking at AEC Dumps
I wish I knew about this one earlier… It was one of the first requests on the bug ticket. And although I had been capturing it, I was unaware how to extract from that dump or the value gained from it. Within chrome://webrtc-internals you can enable this box to allow for the generation of diagnostic audio recordings specific to points around AEC.
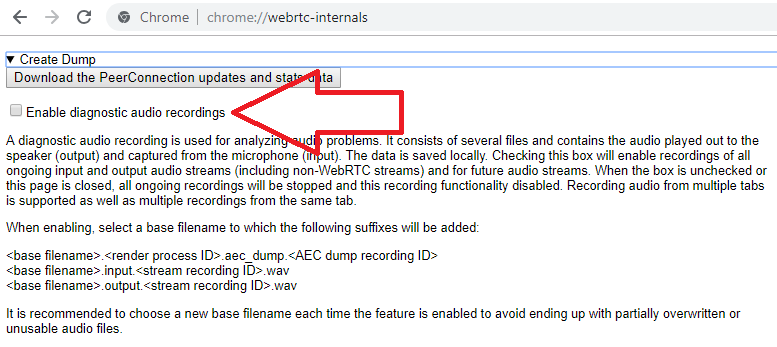
These dumps provide a file called aec_dump which is an archive containing audio recordings of
- the raw audio input signal before any processing
- the processed audio signal before it is passed to the encoder
- the remote audio signal
In order to extract those files, one needs to build the unpack_aecdump from the WebRTC library (or ask your local WebRTC expert). Doing that with the dump provided in the bug resulted in these two files:
Input:
Output:
While the input wav is not distorted you can hear the heavy distortion in the output file. Having known this at the time of encountering the bug would have made pinpointing the root cause easier. It is a highly useful part of the debugging toolkit that was unfortunately not something I had seen previously. And providing this dump when filing an audio bug makes the life of the engineers looking at the bug a bit easier which can help reduce the overall resolution time.
Filing A Bug
Now I personally have never filed a bug before outside of a video game reporting system. Thankfully Google reacted quickly once we learned we were not the only ones affected by the issue. Seeing it occur in Hangouts really solidified this was a larger issue and Twilio was able to help escalate the ticket.
In addition to asking for an AEC dump as described above, there was a question about the variations from the chrome://version page. It became apparent very quickly that this was related the new AEC3 echo canceller which was activated for a certain percentage of Chrome stable users in M69 and M70 (in preparation for rolling it out to all users).
The behavior on the three headset types (expensive models which are rare among consumers but popular in contact centers) was something the WebRTC folks had not seen before, pushing audio in large chunks to the Audio Processing Module (APM). The chunks were 150ms long, larger than what AEC3 assumed to be the maximum input size (104ms).
A fix was prepared swiftly and pushed to Chrome Canary. In Chrome Stable, where the problem happened to the users, it was not possible to merge the fix but there were a number of helpful workarounds suggested, such as disabling echo cancellation (which works because the headsets have a good isolation between speaker and microphone) and even an ingenious way to opt-out of the experiment. The experimentation with AEC3 in Chrome 70 was also stopped as a result a couple of days later. We received no further reports since.
Both the response time as well as providing practical advice on how to work around the issue in Chrome stable was much appreciated.
In Closing
Like with every technical issue, it always helps to start with a simple baseline and develop a profile to work with during the entire incident lifecycle. This one was a particularly major issue for my company. And although I wish it never happened, it has brought my interest of WebRTC back in a new unique way.
So thanks all involved at NewVoiceMedia, Twilio and Google. And thanks Philipp and Chad from webrtcHacks for reaching out and getting me more involved in the community. And all the assistance with this write-up. I needed it!
{“author”: “Al Brooks“}




Thanks Al for this great article!
We have also been struggling with Chrome’s AECs (lack of transparency in noisy environment) and that reminds us a lot what we have been through to troubleshoot the issue. In our case the issue was solved by the ability to use native echo cancellation in Chrome 68 and later. Unfortunately Windows system echo canceller support has been removed in Chrome 71, which brings us back to square one …