Decoding video when there is packet loss is not an easy task. Recent Chrome versions have been plagued by video corruption issues related to a new video jitter buffer introduced in Chrome 58. These issues are hard to debug since they occur only when certain packets are lost. To combat these issues, webrtc.org has a pretty powerful tool to reproduce and analyze them called video_replay. When I saw another video corruption issue filed by Stian Selnes I told him about that tool. With an easy reproduction of the stream, the WebRTC video team at Google made short work of the bug. Unfortunately this process is not too well documented, so we asked Stian to walk us through the process of capturing the necessary data and using the video_replay tool. Stian, who works at Pexip, has been dealing with real-time communication for more than 10 years. He has experience in large parts of the media stack with a special interest in video codecs and other types of signal processing, network protocols and error resilience.
{“intro-by”: “Philipp Hancke“}

WebRTC contains a nice and little known tool called video_replay which has proven very useful for debugging video decoding issues. It’s purpose? To easily replay a capture of a WebRTC call to reproduce an observed behavior. video_replay takes a captured RTP stream of video as an input file, decodes the stream with the WebRTC framework “offline”, and then displays the resulting output on screen.
To illustrate, recently I was working on an issue where Chrome suddenly displayed the incoming video as a corrupt image shown above. Eventually, after using video_replay to debug, the WebRTC team found that Chrome’s jitter buffer reimplementation introduced a bug that made the video stream corrupt in certain cases. This caused the internal state of the VP8 decoder to be wrong and output frames that looked like random data.
Video coding issues are often among the toughest problems to solve. Initially I was able to develop a test setup that reproduced the issue in about 1 out of every 20 calls. Replicating the issue this way was very time consuming, often frustrating, and ultimately did not make it easy for the WebRTC team to find the fix. To consistently reproduce the problem I managed to get a Wireshark capture of one of the failing calls and fed the capture into the video_replay tool. Voilà! Now I had a test case that reproduced this rare issue every single time. When an issue is as reproducible as this it’s usually very attractive for someone to grab and implement a fix quickly. A classic win-win situation.
In this post I’ll demonstrate how to use video_replay by going through an example where we capture the RTP traffic of a WebRTC call, identify and extract the received video stream, and finally feed it into video_replay to display the captured video on screen.
Capture unencrypted RTP
video_replay takes the input file and feeds it into the RTP stack, depacketizer and decoder. However, it currently lacks the capability to decrypt SRTP packets for encrypted calls. Encrypted calls is the norm for both Chrome and Firefox. Decrypting a WebRTC call is not a trivial process, in particular since DTLS is used to securely share the secret key that’s used for SRTP so the key is not easy to get. To get around this, it’s better to use Chromium or Chrome Canary since they have a flag that will disable SRTP encryption. Simply start the browser with the command-line flag –disable-webrtc-encryption and you should see warning should be displayed at the top of your window that you’re using an unsupported command-line flag. Note that it’s necessary that both parties in the call run unencrypted; if not, the call will fail to connect.
First, start to capture packets using Wireshark. It’s important to start the capture before the call starts sending media so that you make sure the entire stream is recorded. If the beginning of the stream is missing from the capture, the video decoder will fail to decode it.
Second, open a tab and go to chrome://webrtc-internals (or Fippo’s new webrtc-externals). Do this prior to the call in order to get all the information needed, specifically the negotiated SDP (see the webrtcHacks SDP Anatomy guide here for help interpreting this).
Finally, it’s time to make the call. We’ll use appr.tc as an example, but any call that’s using WebRTC will work. Open a second tab and go to https://appr.tc/?ipv6=false. In this particular example I disabled IPv6 because of a currently unresolved issue with with video_replay, but I expect that to be fixed very soon.
Now, join a video room. RTP will start flowing when a second participant joins the same room. It doesn’t matter who joins first, except that chrome://webrtc-internals will look slightly different. The screenshots below were taken when dialing into an existing room.
Gather information
In order to successfully extract the RTP packets for the received video stream and successfully play them with video_replay we need to gather some details about the RTP stream. There are a few ways to go about this, but I’ll stick to what I believe will give the clearest instructions. What we need is:
- Video codec
- RTP SSRC
- RTP payload types
- IP address and port
Gathering stats with webrtc-internals
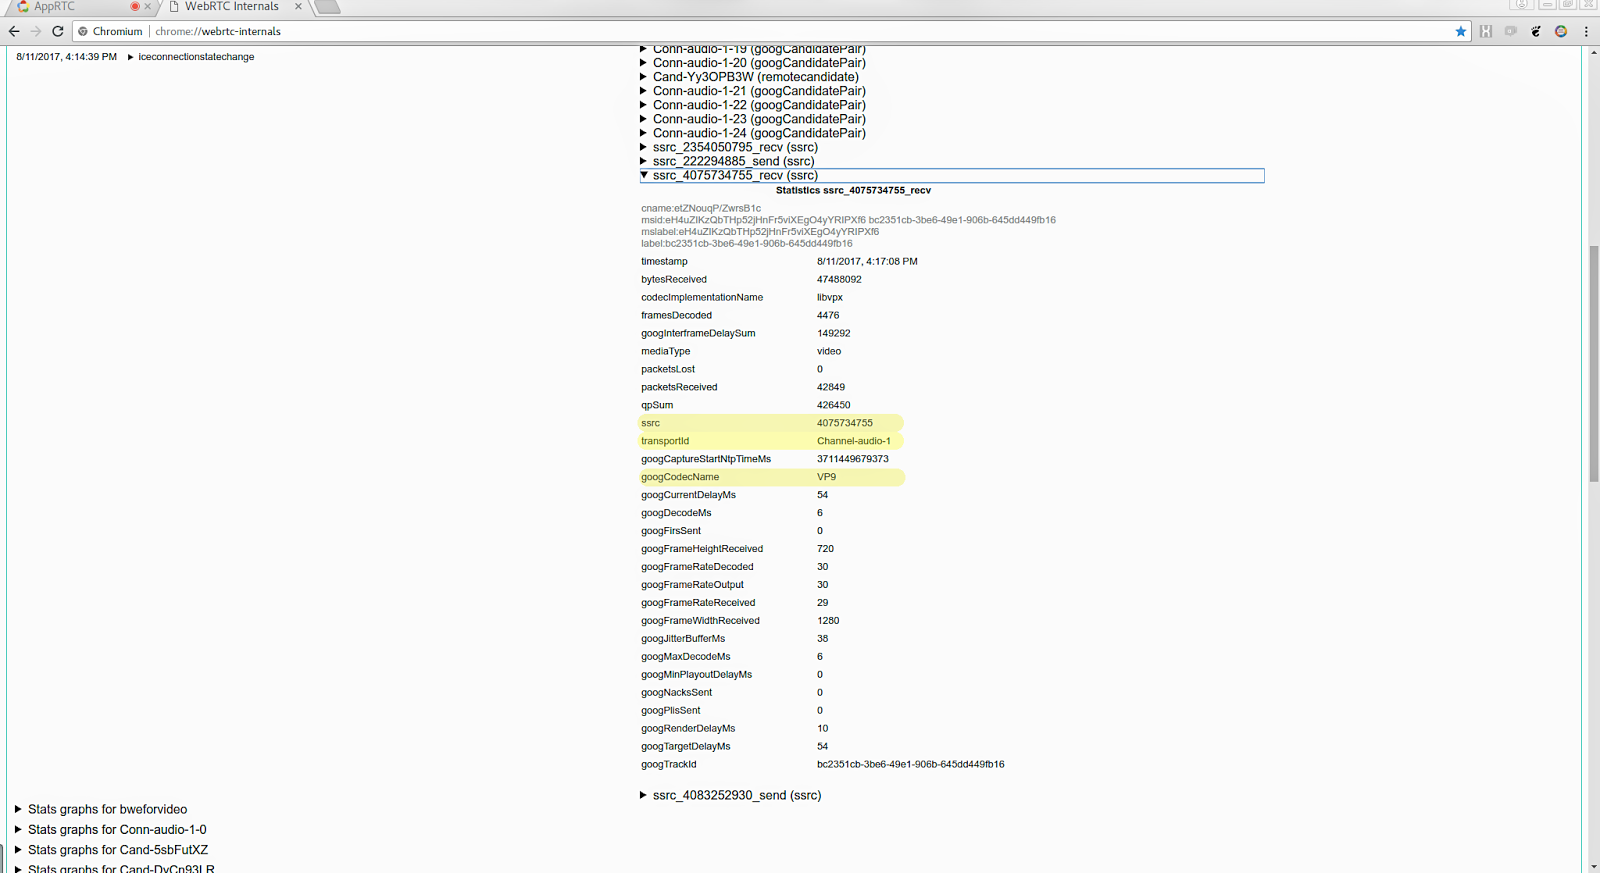
First, expand the stats table for the received video stream, which will have a name like ssrc_4075734755_recv . There may be be more than one, typically a second stream for audio, and possibly a couple that has the _send suffix which holds the equivalent statistics for the sent streams. The stats for the received video stream are easily identified with the _recv suffix and mediaType=video . Make a note of the fields ssrc , googCodecName and transportId , which is 4075734755, VP9 and Channel-audio-1 respectively.
You may ask why the video stream has the same transportId as the audio channel? This means that BUNDLE is in use which makes audio and video share the same channel. If BUNDLE is not negotiated and in use, audio and video will use separate channels.
Next, we’ll look at the negotiated SDP to get the RTP payload types (PT). In addition to the PT for the video codec in use, we must also find the PT for RED which WebRTC uses to encapsulate the video packets. SDP describes the receive capabilities of a video client, so in order to find the payload types we receive we must look at the SDP our browser offers to the other participant. This is found by expanding the setLocalDescription API call, find the section m=video and the following rtpmap attributes that defines the PT for each supported codec. Since our video codec is VP9, we’ll note the fields a=rtpmap:98 VP9/90000 and a=rtpmap:102 red/9000 , which tells us that the payload types for VP9 and RED are 98 and 102, respectively.
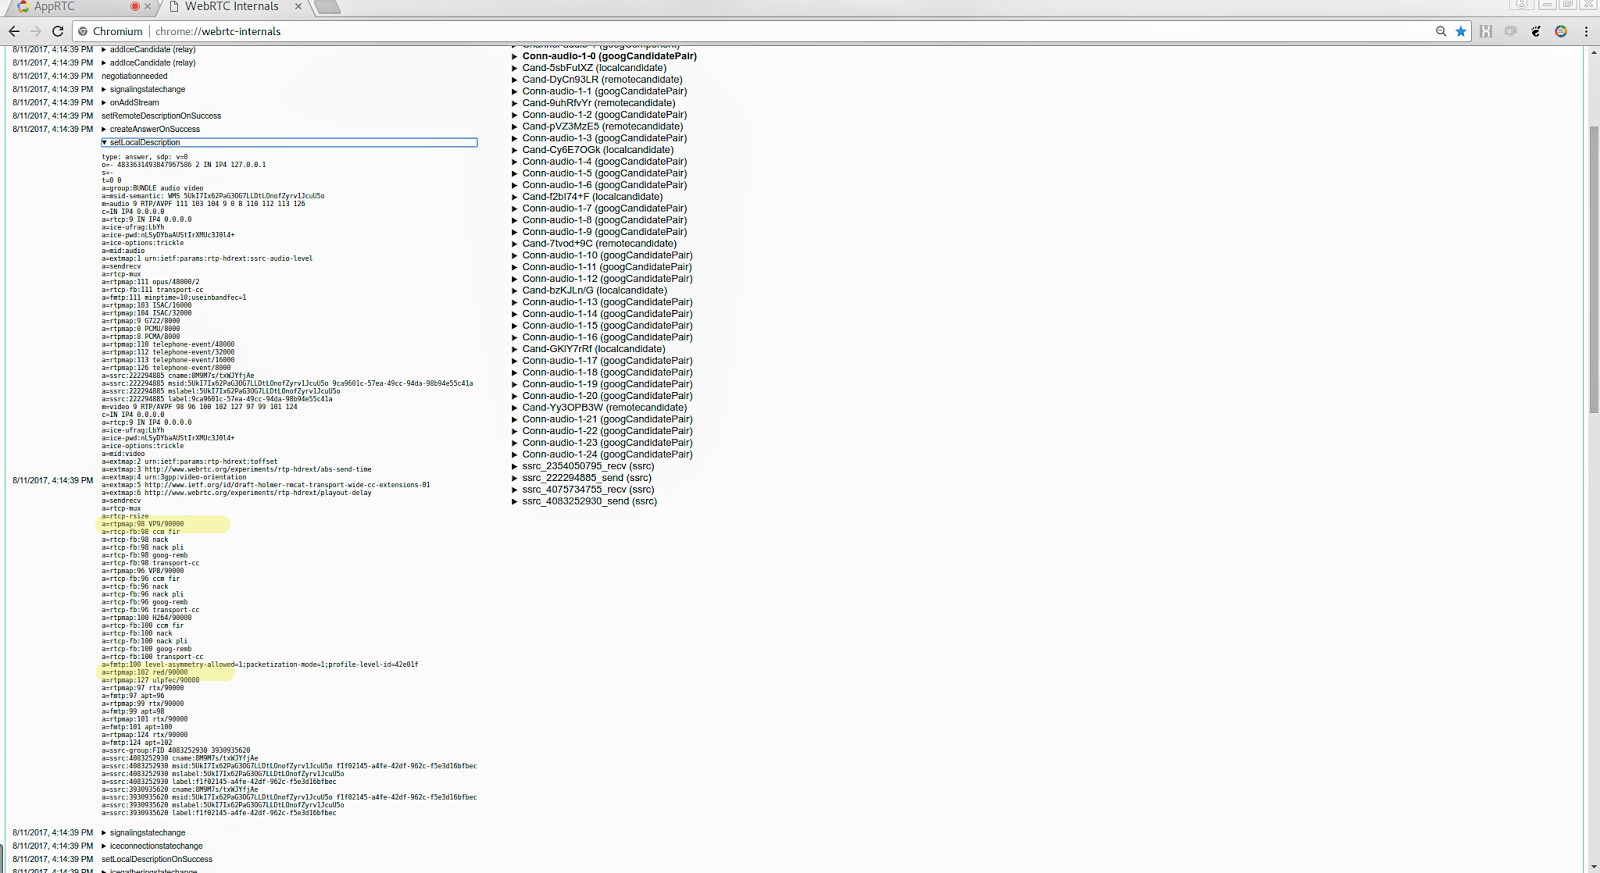
If you’re looking for information regarding the sent stream instead of the received stream, you should look at what the other participant has signaled by expanding setRemoteDescription instead. In practice, however, the payload types should be symmetrical, so whether you look at setLocalDescription or setRemoteDescription shouldn’t matter, but in the world of real-time video communication you never know…
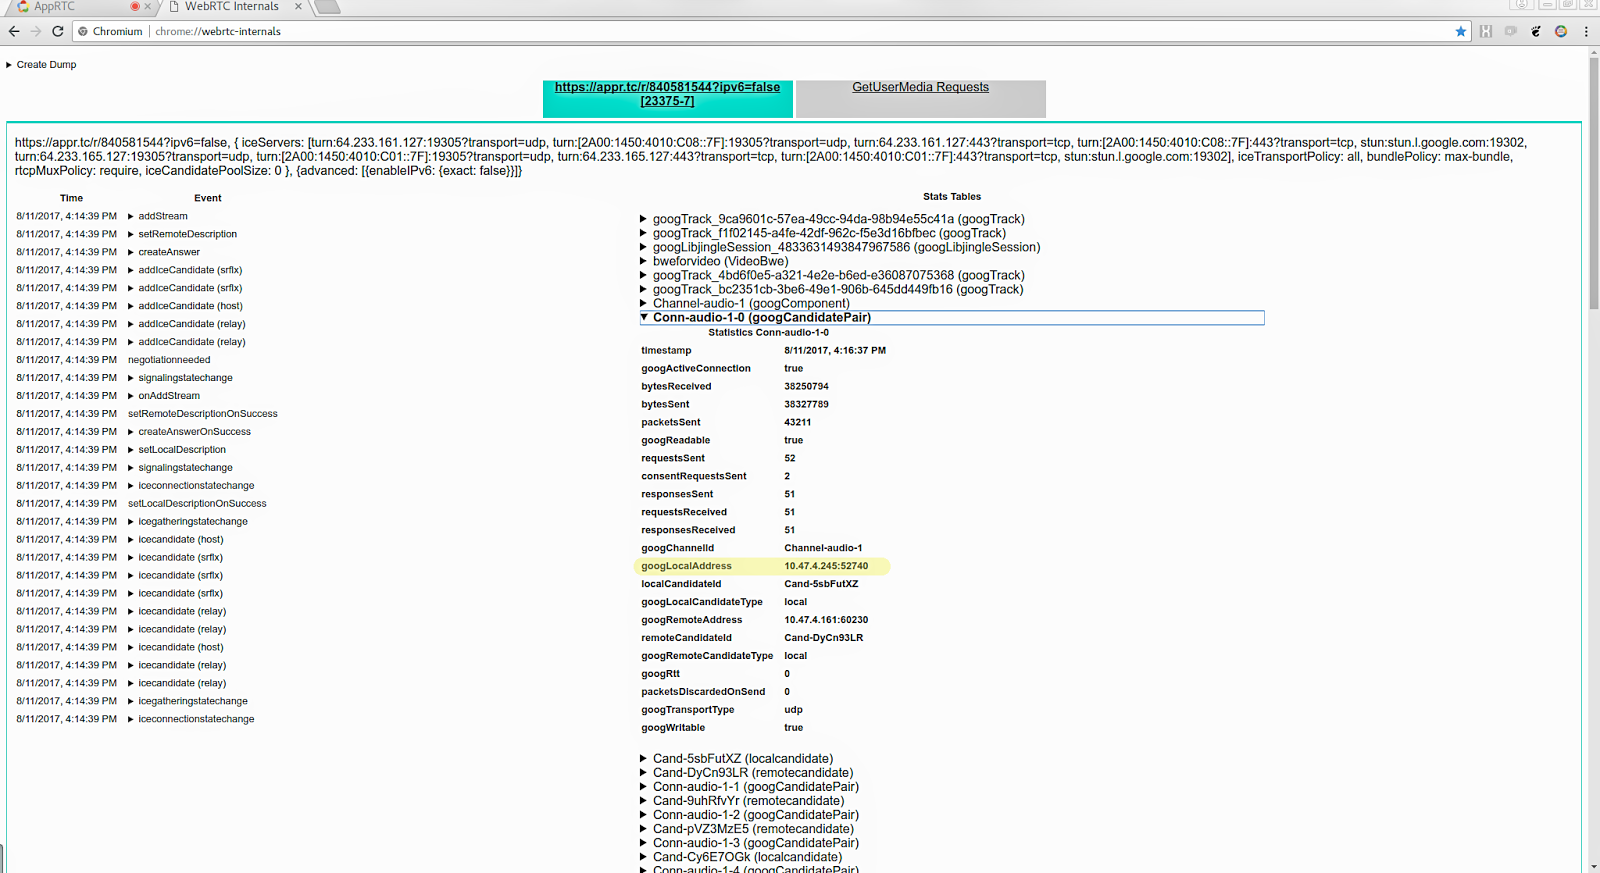
In order to quickly identify the correct RTP stream in Wireshark it’s very useful to know the IP address and port that’s being used. Whether you look at the remote or local address doesn’t matter as long as the appropriate Wireshark filter is applied. For this example we’re going to use the local address, which is the destination of the packets we’re interested in since we want to extract the received stream. chrome://webrtc-internals contains connection stats in the sections that starts with Conn-audio and Conn-video . The active ones will be highlighted with bold font, and based on the transportId in previous step we know wether to look at the audio or video channel. To find the local address in our example we need to expand Conn-audio-1-0 and note the field googLocalAddress , which has the value 10.47.4.245:52740
RTP marking in Wireshark
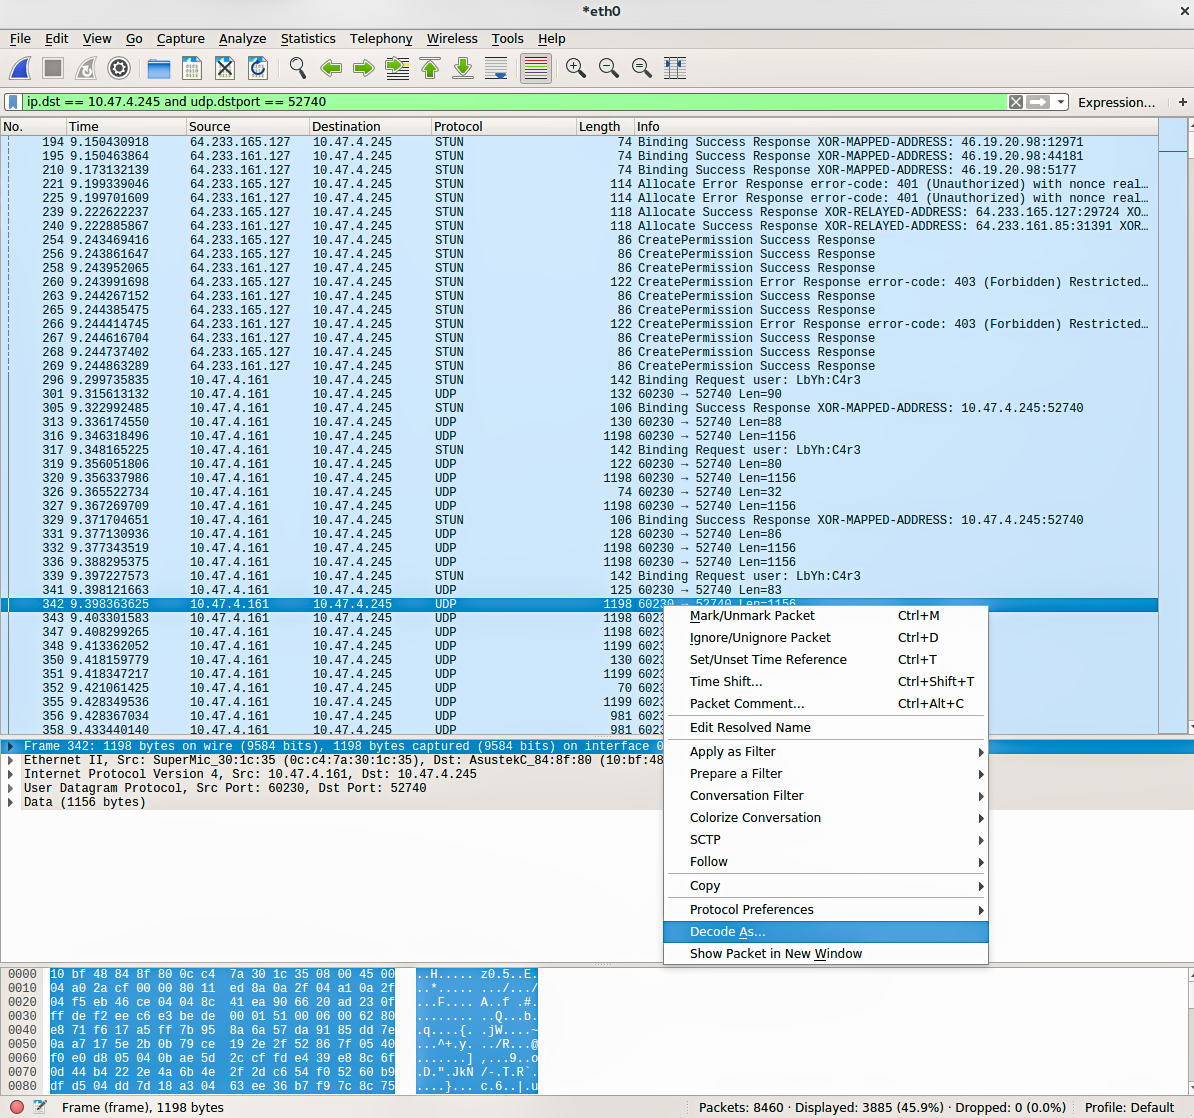
Now that we have collected all the information necessary to easily identify and extract the received video stream in our call. Wireshark will likely show the captured RTP packets simply as UDP packets. We want to tell Wireshark that these are RTP packets so that we can export them to rtpdump format.
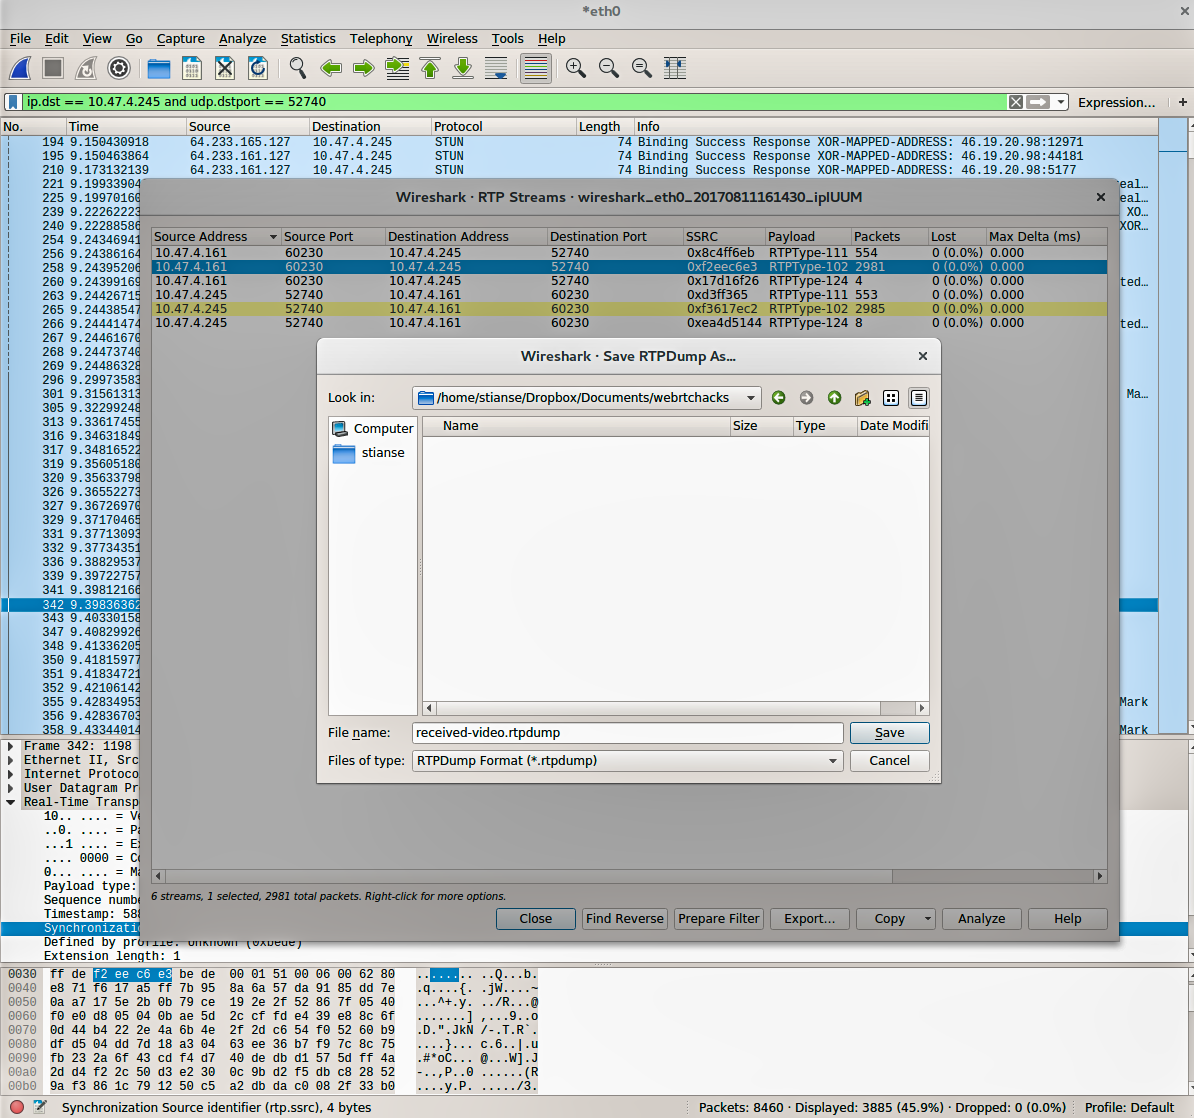
First, apply a display filter on address and port, e.g. ip.dst == 10.47.4.245 and udp.dstport == 52740. Then, right click a packet, select Decode As, and choose RTP.
Second, list all RTP streams by selecting from the menu Telephony → RTP → RTP Streams. The SSRC of our received video stream will be listed together with other streams. Select it and export it as rtpdump format. (video_replay also supports the pcap format, but because of very limited support for various link-layers I generally recommend to use rtpdump.) Finally we have a file that contains only the received video packets which can be fed into video_replay.
Build WebRTC and video_replay
You need to build video_replay from the WebRTC source before you can use it. General instructions on how to set up the environment, get the code and compile are found at https://webrtc.org/native-code/development. Note that in order to build video_replay the tool has to be explicitly listed as a target when compiling. In short, after making sure that the prerequisite software is installed, the following commands will get the code and build video_replay.
|
1 2 3 4 5 6 7 |
mkdir webrtc-checkout cd webrtc-checkout/ fetch --nohooks webrtc gclient sync cd src gn gen out/Default ninja -C out/Default video_replay |
Use video_replay to playback the capture
Finally we’re ready to replay our captured stream and hopefully display it exactly how it appeared at appr.tc originally. The minimal command line to do this for our example is:
|
1 |
out/Default/video_replay -input_file received-video.rtpdump -codec VP9 -media_payload_type 98 -red_payload_type 102 -ssrc 4075734755 |
(note: the media_payload_type argument was named payload previously)
The command line arguments are easy to understood from the previous text.
video_replay arguments
If your goal is to reproduce a WebRTC issue and post a bug, providing the rtpdump together with the command line arguments to replay it will be tremendously helpful for certain issues. However, if you want to do some more debugging on your own video_replay has a a few more command line options that may be of interest.
Let’s look at the current help text and explain what the different options do.
Flags from ../../webrtc/video/replay.cc at the time of this writing:
|
1 2 3 4 5 6 7 8 9 10 11 12 |
-abs_send_time_id (RTP extension ID for abs-send-time) type: int32 default: -1 -codec (Video codec) type: string default: "VP8" -decoder_bitstream_filename (Decoder bitstream output file) type: string default: "" -fec_payload_type (ULPFEC payload type) type: int32 default: -1 -input_file (input file) type: string default: "" -out_base (Basename (excluding .yuv) for raw output) type: string default: "" -payload_type (Payload type) type: int32 default: 123 -payload_type_rtx (RTX payload type) type: int32 default: 98 -red_payload_type (RED payload type) type: int32 default: -1 -ssrc (Incoming SSRC) type: uint64 default: 12648429 -ssrc_rtx (Incoming RTX SSRC) type: uint64 default: 195939069 -transmission_offset_id (RTP extension ID for transmission-offset) type: int32 default: -1 |
And here is what they mean with some more explanation:
| Flag | Description | Required? |
|---|---|---|
| abs_send_time | The RTP extension ID for the abs-send-time extension | Optional |
| codec | The video codec associated with payload_type and defines the codec used to decode the stream | Required |
| decoder_bitstream_filename | File to save the received bitstream after depayloading and before decoding. The bitstream will be dumped to file without any type of container or frame delimiters and cannot be decoded as far as I know. It may, however, be useful for visual inspection of the bits |
Optional |
| fec_payload_type | The RTP payload type for Forward Error Correction packets. FEC is a mechanism to improve quality when there is packet loss. The payload type for FEC can be parsed from the SDP, e.g a=rtpmap:127 ulpfec/90000 |
Optional |
| input_file | The file to replay. This can either be rtpdump or pcap. Currently only LINKTYPE_NULL and LINKTYPE_ETHERNET is supported for pcaps, which makes its use case a bit limited |
Required |
| out_base | Save the decoded frames to file in uncompressed format (I420) | Optional |
| payload_type | The payload type of the video packets to be decoded, as explained earlier | Required |
| payload_type_rtx | The payload type of RTP retransmission (RTX) packets in the case of packet loss. The payload type of such packets is also found in the SDP. Note that there are multiple payload types for RTX. Make sure to use the one that is associated with the correct payload_type, e.g. a=rtpmap:99 rtx/90000 a=fmtp:99 apt=98 says that payload type 99 is retransmission of packets with payload type 98 |
Optional |
| red_payload_type | The payload type of RED, as explained earlier | Optional |
| ssrc | The SSRC of the stream to decode, as explained earlier | Required |
| ssrc_rtx | The SSRC of the RTX stream. This value is actually found in the SDP offered by the sender side, as opposed to the receiver side as everything else we’ve looked at. It’s found in the attribute ssrc-group, e.g.
a=ssrc-group:FID 4075734755 3957275412, where 3957275412 is the SSRC for RTX |
Optional |
| transmission_offset_id | The RTP extension ID for the transmission offset extension | Optional |
Shortcuts
When you get familiar with process above there are a couple of shortcuts you can apply in order to be more effective.
First, you can often identify the RTP video packets in Wireshark without looking at chrome://webrtc-internals. Most video packets are usually more than 1000 bytes, while audio packets are more like a couple of hundred bytes. Decode the video packet as RTP and Wireshark will display both the SSRC and payload type. Wireshark doesn’t automatically know is whether RED is used or not, but from experience you can probably guess that too since payload types normally don’t change between calls.
Second, if your pcap is supported by video_replay you can feed the original pcap directly into video_replay. There will be a lot of noise on the command line output as it ignores all the unknown packets, but it will decode and display the specified stream.
{“author”, “stian selnes“}


Interesting article, thanks for sharing!
To share our experience, we have a similar feature in Janus, which we mostly use for recording but sometimes for debugging as well. Our recordings basically consist in a structured dump of the plain RTP packets we receive (so after the Janus core has decrypted the SRTP layer) to a custom format, and we have a simple tool to go through that file offline and depacketize the payload to a playable format (e.g., webm), in a similar but probably less sophisticated way to how video_replay seems to work. The cool thing is that we don’t need to disable encryption, which wouldn’t work anyway when setting up the PeerConnection with Janus, but the custom format makes it less reusable (e.g., for bug reports). Adding support for rtpdump and/or pcap as well, besides our custom target file, would indeed be an interesting way to make debugging even easier, so thanks again for this cool tutorial!
on the serverside logging in text2pcap format is pretty simple and powerful. grep from logs + convert with
text2pcap -D -n -u 1000,2000 -t "%H:%M:%S." \!:1 \!:2is magic (courtesy of randell jesup) 😉Will definitely have a look at that, thanks for the tip!
apparently we have to not only thank Randell but also Michael Tüxen who originally came up with it. So… thank you Michael 🙂
Yep, usrsctp has the same feature, very helpful!
This is really good stuff !
However I have a problem generating the Ninja project file, Running the [gn gen out/Default] command on a windows environment (from a command prompt started with administrator privilege).
I don’t see any error in the previous phases, but when running the generation I get the below error. Has any one seen this ?
(unfortunately I only have a windows environment at home…)
ERROR at //third_party/protobuf/proto_library.gni:229:15: File is not inside out
put directory.
outputs = get_path_info(protogens, “abspath”)
^———————————
The given file should be in the output directory. Normally you would specify
“$target_out_dir/foo” or “$target_gen_dir/foo”. I interpreted this as
“//out/Default/gen/webrtc/rtc_tools/event_log_visualizer/chart.pb.h”.
See //webrtc/rtc_tools/BUILD.gn:184:3: whence it was called.
proto_library(“chart_proto”) {
^—————————–
See //BUILD.gn:16:5: which caused the file to be included.
“//webrtc/rtc_tools”,
^——————-
Traceback (most recent call last):
File “D:/temp/webrtc-checkout/src/build/vs_toolchain.py”, line 459, in
sys.exit(main())
File “D:/temp/webrtc-checkout/src/build/vs_toolchain.py”, line 455, in main
return commands[sys.argv[1]](*sys.argv[2:])
File “D:/temp/webrtc-checkout/src/build/vs_toolchain.py”, line 431, in GetTool
chainDir
win_sdk_dir = SetEnvironmentAndGetSDKDir()
File “D:/temp/webrtc-checkout/src/build/vs_toolchain.py”, line 424, in SetEnvi
ronmentAndGetSDKDir
return NormalizePath(os.environ[‘WINDOWSSDKDIR’])
File “D:\temp\depot_tools\win_tools-2_7_6_bin\python\bin\lib\os.py”, line 423,
in __getitem__
return self.data[key.upper()]
KeyError: ‘WINDOWSSDKDIR’
For replay of audio RTP streams, captured or simulated, I’ve found SIPP to be a useful tool to exercise jitter buffers and reproduce errors as it plays out with more or less correct timing, and handles the sip signalling. Does anyone know any other RTP regurgitators? Fantastic post, thanks for sharing and documenting!
Great Article!!
To decode H264, you need to explicitly request it at makefile creation time
gn gen out/Default –args=’rtc_use_h264=true ffmpeg_branding=”Chrome”‘
ninja -C out/Default video_replay
video_replay –input_file d3.rtpdump –ssrc 2176537790 –media_payload_type 96 –codec H264
The video_replay tool has been moved to rtc_tools: https://chromium.googlesource.com/external/webrtc/+/refs/heads/master/rtc_tools/video_replay.cc
Note: video_replay supports simple pcaps nowadays (while text2pcap’s -n writes pcapng)
Wiresharks support for exporting rtpdumps seems to be limited to a single ssrc which is not good for rtx.
I just landed a chrome change which should simplify the whole process:
–enable-logging=1 –v=3 –force-fieldtrials=WebRTC-Debugging-RtpDump/Enabled/
will dump lines with a grep-able postfix RTP_DUMP into the log file, similar to the existing SCTP_DUMP.
See https://bugs.chromium.org/p/webrtc/issues/detail?id=10675 for details.