The performance of WebRTC in Chrome as well as other RTC applications needed to be improved a lot during the pandemic when more people with a more diverse set of machines and network connections started to rely on video conferencing.
Markus Handell is a team lead at Google who cares a lot about performance of WebRTC in Chrome (at least when he is not kiteboarding in the cold waters of Sweden). I saw him fixing a performance issue that was blocking the unified-plan transition in 2021 and wanted to learn more about the tooling used to find the root cause and in the end improve performance drastically. We hope that giving the community a better understanding of these tools and techniques will lead to more actionable performance issues being filed against WebRTC and Chrome as well as happier users who stop complaining about their CPU fans being too loud.
{“editor”, “philipp hancke“}
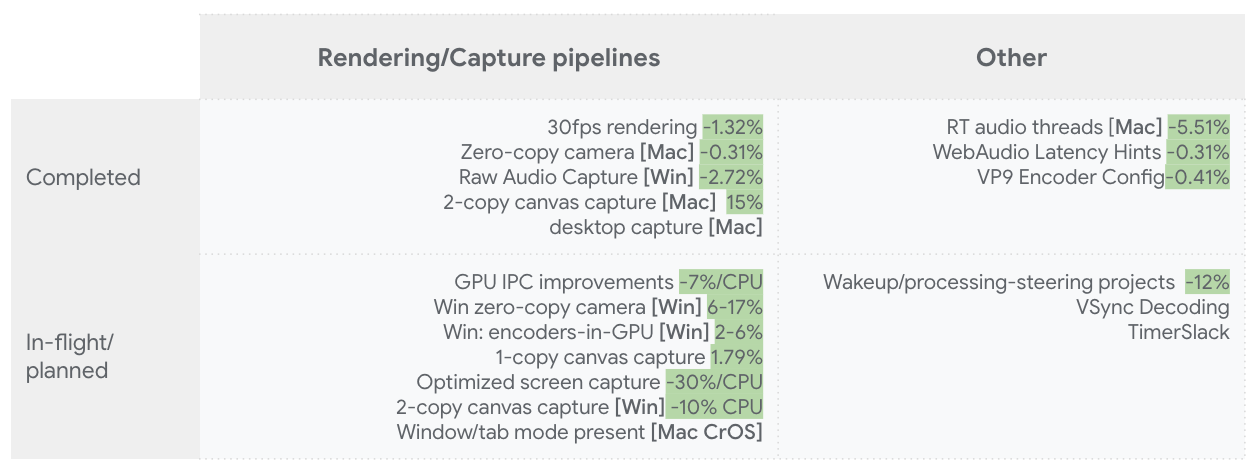
In the 2021 issue of Kranky Geek, Google WebRTC team director Tomas Gunnarsson and PM Huib Kleinhout shared details on some of the performance optimizations that were made during the year. This article describes tools and techniques that are used to identify areas of code that consume a lot of power.
Read this article if you want to learn how to profile the impact of how your website operates in Chrome, or just generally want to profile the impact of some native application you’re interested in.
In terms of tools and techniques, I’ll briefly go over
- pprof – our visualization tool for profiles
- Time profiling – for estimation of where CPU is spent in the application
- Wakeup profiling – for an estimation of what is waking up the CPU from sleep
- Chrome tracing – for looking at events in timeline mode
Why is the WebRTC team investing heavily in performance?
The pandemic changed the way many people interact with their computers during meetings. Instead of using their computers as mostly-idle companions to in-person interactions, they’re forced to multitask much more on their computers during large video calls, placing much greater stress on the hardware than before. Additionally, the nature of online meetings has changed as well: during calls, people like to use computationally expensive features such as background blur or background replace, video noise cancellation, and similar technologies.
The scale of online meetings and usage has also increased, with more people working in remote or hybrid settings. All in all – it’s becoming common for people to max out the capabilities of their hardware, while continuing to expect seamless operation at all times.
What are the problems that are being addressed?
There are several primary problem areas that have addressed, but need to see deeper transformation to address the needs of hybrid and remote work:
- Short battery life. For the user, apart from the eternal “where’s my charger?” question, it’s also annoying to always have to make short-term plans with battery levels in mind.
- Thermal throttling. This is something operating systems or even CPUs (like SpeedShift on Intel Core 6th gen forward) like to do when temperatures in critical processing components on the motherboard get too high. During throttling, the speed of the CPU is decreased so as to enable the power consumed by the processor to drop, giving the operating system knobs by which it can protect the computing hardware. Unfortunately, the details of how this is done or even methods of detection is largely covered in mist due to the very wide array of computing hardware, vendors, and operating systems.
After a computer has started thermal throttling, processing capability typically falls steeply and doesn’t recover for significant time. It’s a state that no user wants to be in. - Jank, i.e. irregularly updating user interface, freezes, etc. Jank can be caused by long processing times (see below for a deep-dive into debugging this kind of problem), but it can also be secondarily caused by thermal throttling computers.
- Fan noise from the computer trying to lower its temperature. Being in noisy environments disrupts cognitive abilities for most people, or is at best just very annoying.
One big cause of these problems is excessive power consumption. Reducing power consumption increases battery life, reduces fan noise, and puts a smaller percentage of users across the thermal throttling cliff, which as a bonus also improves the fraction of users with jank problems.
CPU% and Wakeups: Links to power
A problem with power consumption is that it’s often not straightforward to profile and understand the biggest causes that can be actionably changed from the perspective of software like the WebRTC stack. Proxy metrics are often needed. An example of such a metric in use is Apple’s Activity Monitor “energy impact” metric documented with definition:
“A relative measure of the current energy consumption of the app (lower is better)”
The metric is further analyzed on a Mozilla blog post and is revealed to be some combination (linear?) of CPU loading, interrupt/wakeup frequency, network packets, and other events (like disk, etc) which are not as commonly occurring in RTC applications. Configuration files under /usr/share/pmenergy carry different coefficients for different computer models. The main virtue of the metric for us is that reducing either constituent event type on its own should decrease power consumption, not solely the amount of work performed in CPU%. This is further supported by Intel’s Energy-Efficient Platforms documentation where the utility of being in CPU power save modes is delved into in great depth. Frequent wakeups naturally inhibit prolonged stay in deeper power-saving modes because it takes time to enter them.
The connection between event types and power are a little hand-wavingly described above, but the theory doesn’t need to be 100% accurate. Sources of CPU% and Idle wakeups can be easily profiled in software without extra equipment, so they are great sources to find areas to act upon.
Assuming that a reduction of CPU% and events like idle wakeups reduce power, projects reducing either source are expected to reduce power. Whether project ideas do save power in reality still needs careful measurements in an A/B setting to ensure successful outcomes. And there are sometimes surprises:
CPU reduction projects often increase CPU Package Idle wakeups
This is because wakeups (often timers) that previously took place when the package was busy are now happening while it’s idle instead.
Idle wakeup reduction projects aren’t expected to give a power impact until the fraction of time all CPUs are in power-save states is significantly increased.
Although many power-optimization projects may be required, benefits aren’t realized until the final improvements land. But wakeup reduction ideas often reduce overhead so you may see power benefit due to that.
pprof and time profiling
CPU Profiling is probably the most conventional way to look at where CPU time is going in an application. In essence, while profiling we have a regular tick going, and we collect stacks for all running processors. If we take many samples, we’ll end up with frequencies of various stacks. Thousands. Data can be difficult to aggregate and comprehend. Fortunately, we have a great tool for this at Google which also happens to be open-sourced: pprof! The tool’s visualization engine is based on flame graphs (example below) and allows for detailed insight into where time is spent.
However, major operating systems have their own technology for CPU profiling, and the method of transferring the native format to pprof is different. To name a few of the technologies:
- Linux uses perf. A nice feature of pprof is that it supports perf files natively!
- Windows has a subsystem called ETW (Event Tracing for Windows), for which probe actions are specified on the command line. Probe invocations are subsequently recorded into ETL files. Chromium GPU team member Sunny Sachanandani has created EtwToPprof for the conversion into pprof files.
For more deep dives into ETW I can recommend looking into Bruce Dawson’s posts related to the subject, like this summary post. - For macOS, one uses Instruments which is part of the Xcode developer tools. Instruments is based on the DTrace technology originally developed by Sun Microsystems. WebRTC team member Evan Shrubsole has created instrumentsToPprof to convert Instruments trace information into pprof files.
To exemplify the typical output of pprof and workflows, I’ve built Chromium Mac and run a 2-party audio/video muted Meet call where I screen share a chrome://about tab which isn’t animating. I’m taking a trace from the sender side, Deep Copying (following instructions on GitHub), and converting it with instrumentsToPprof and finally launching the pprof web UI and selecting “flame graph” under the view menu.
|
1 2 3 4 |
$ xcrun -r xctrace record --template 'Time Profiler' --all-processes --time-limit 10s --output=Control.trace $ # DEEP COPY RELEVANT PROCESSES IN INSTRUMENTS $ pbpaste | ~/go/bin/instrumentsToPprof --output Control.pb.gz -exclude-ids $ ~/go/bin/pprof -http=localhost:8800 Control.pb.gz |
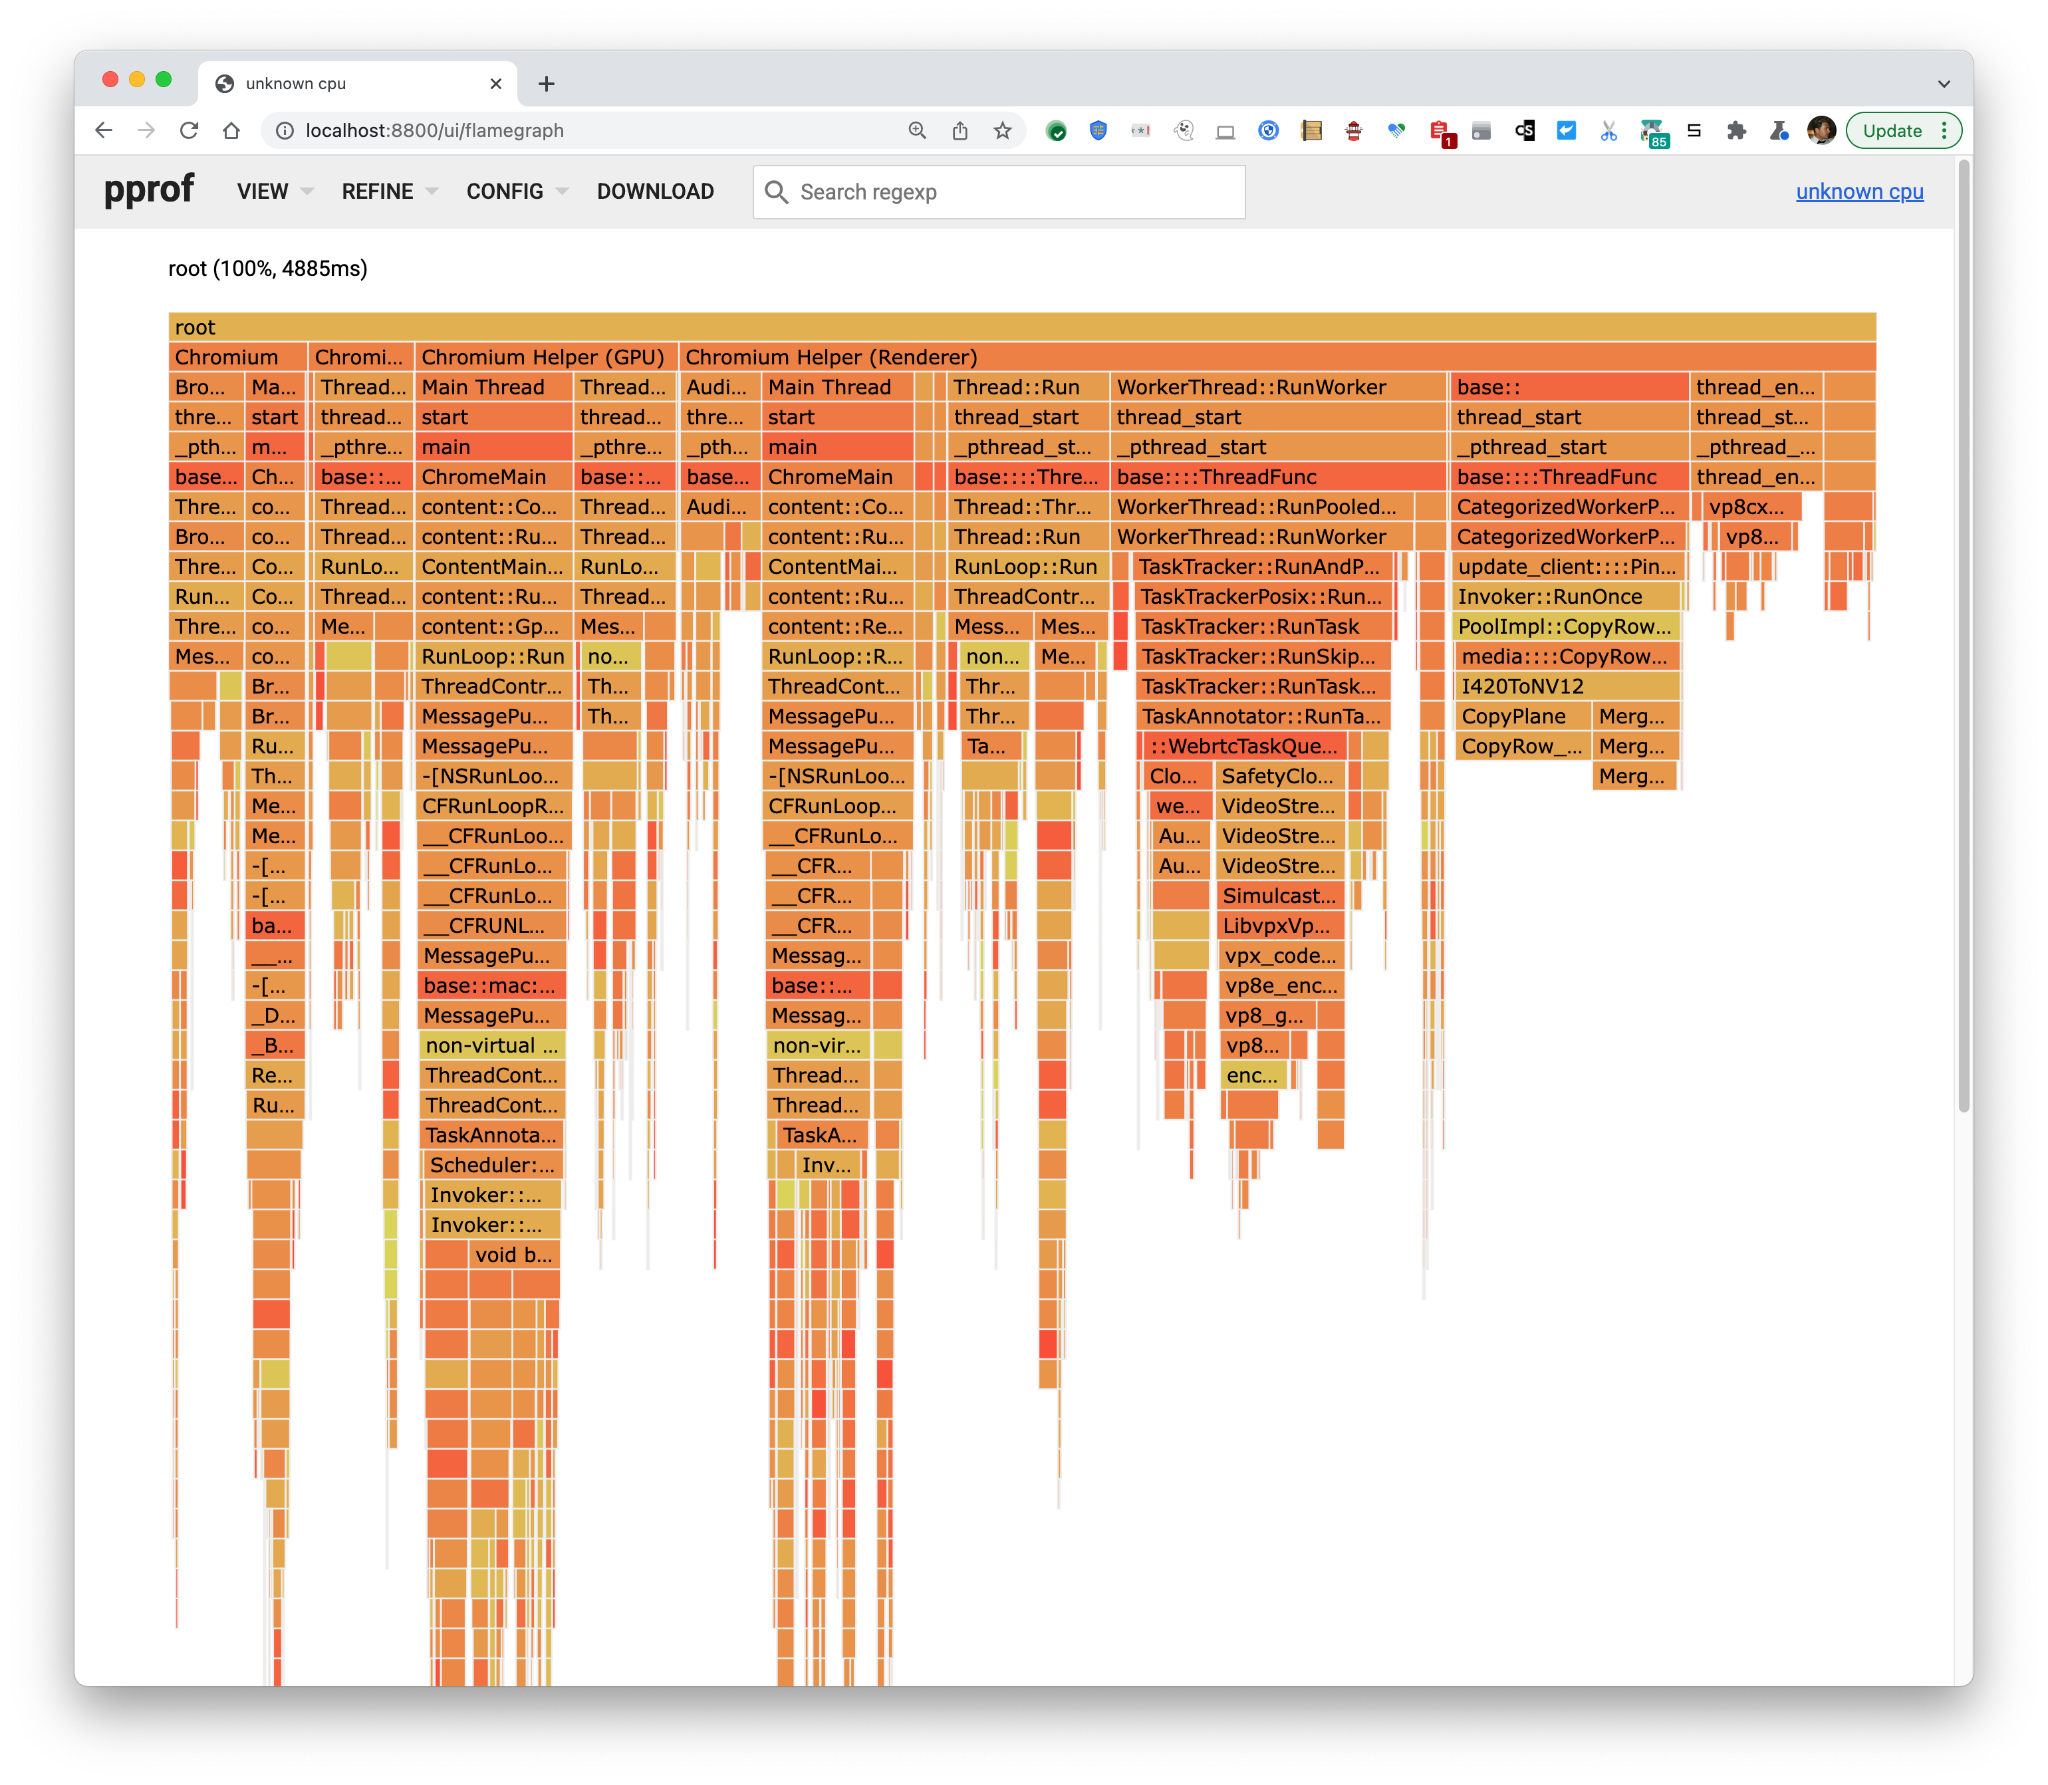
Overall CPU load was 4885 ms/10 seconds (10 s was the capture time limit) of a CPU ~= 49% of a CPU. From the third column from the right, it seems that we’re spending time encoding (not so surprising), but even more time than that we’re converting I420 images to NV12. For reasons I’m not delving into here, this is overhead.
In order to show the output of the tool under effects of a change I’m working on in WebRTC, I’ve taken another trace of how conditions look under the change.
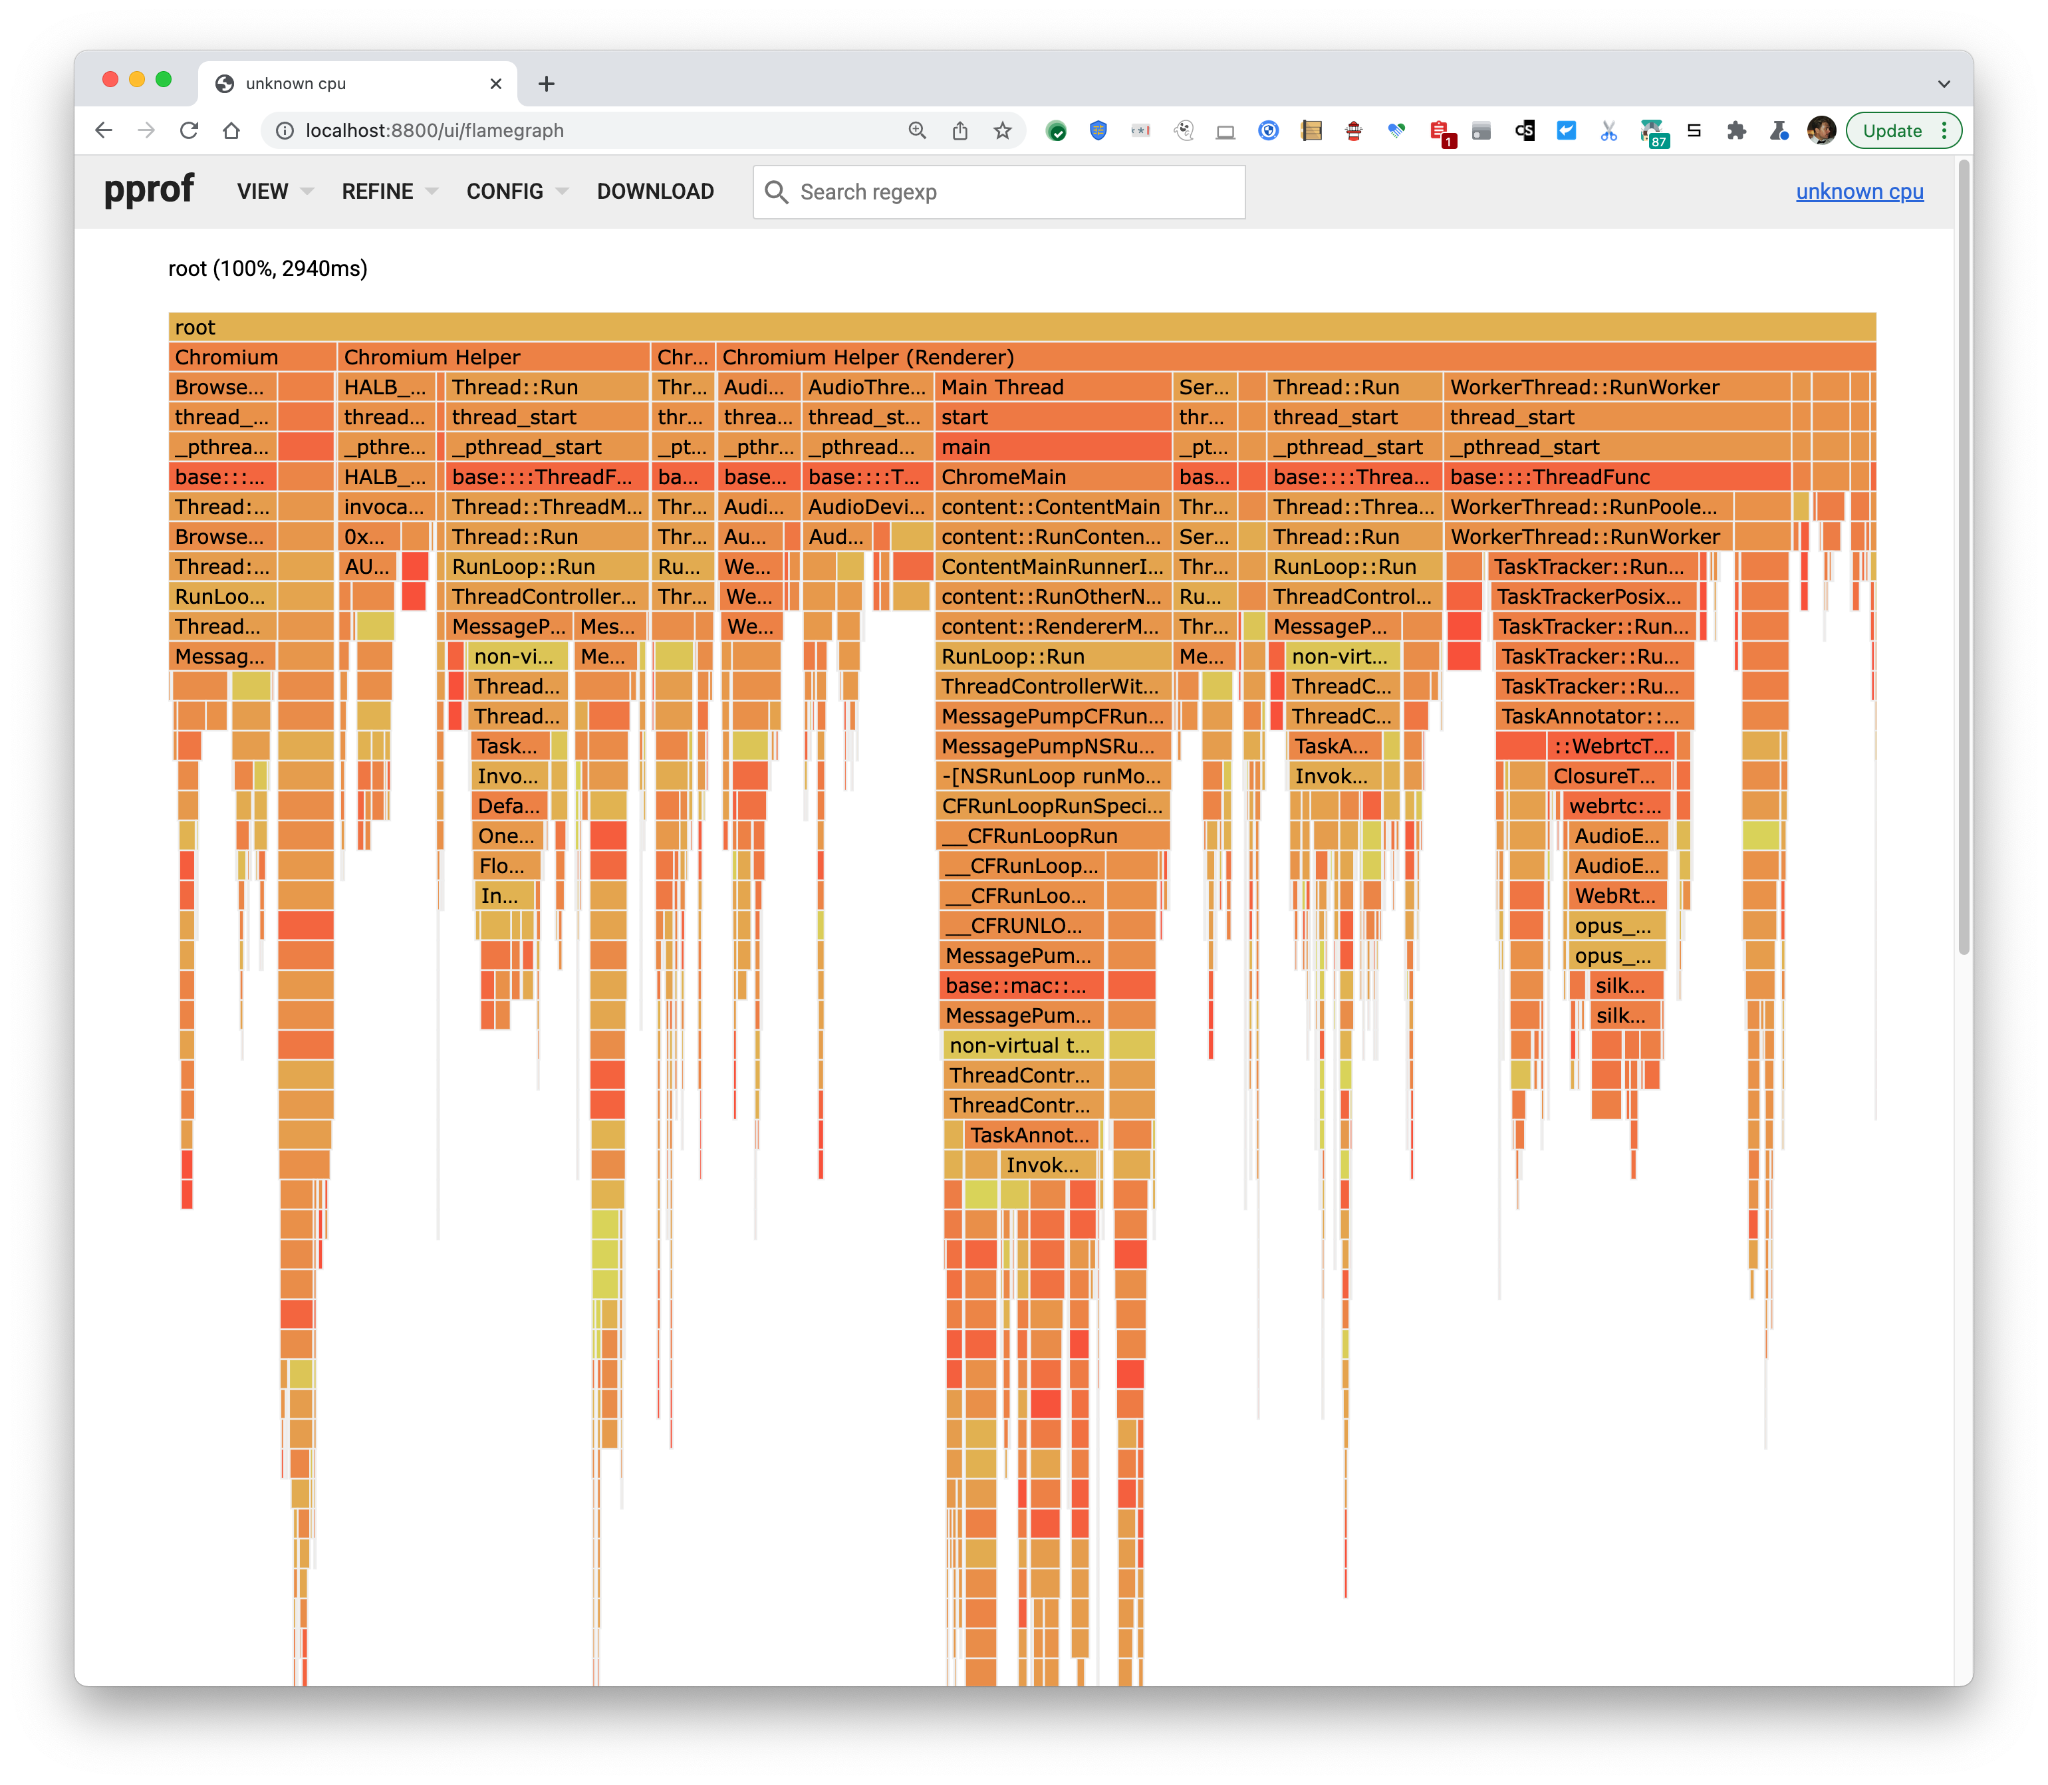
Here load was 29% of a CPU. It’s not easy to figure out what changed other than that the total has decreased the consumed milliseconds a lot and the big blob of I420→NV12 conversion is gone. Fortunately, pprof has a diff mode which you can access by using the control pprof as a diff base:
|
1 |
$ ~/go/bin/pprof -http=localhost:8800 -diff_base=Control.pb.gz Experiment.pb.gz |
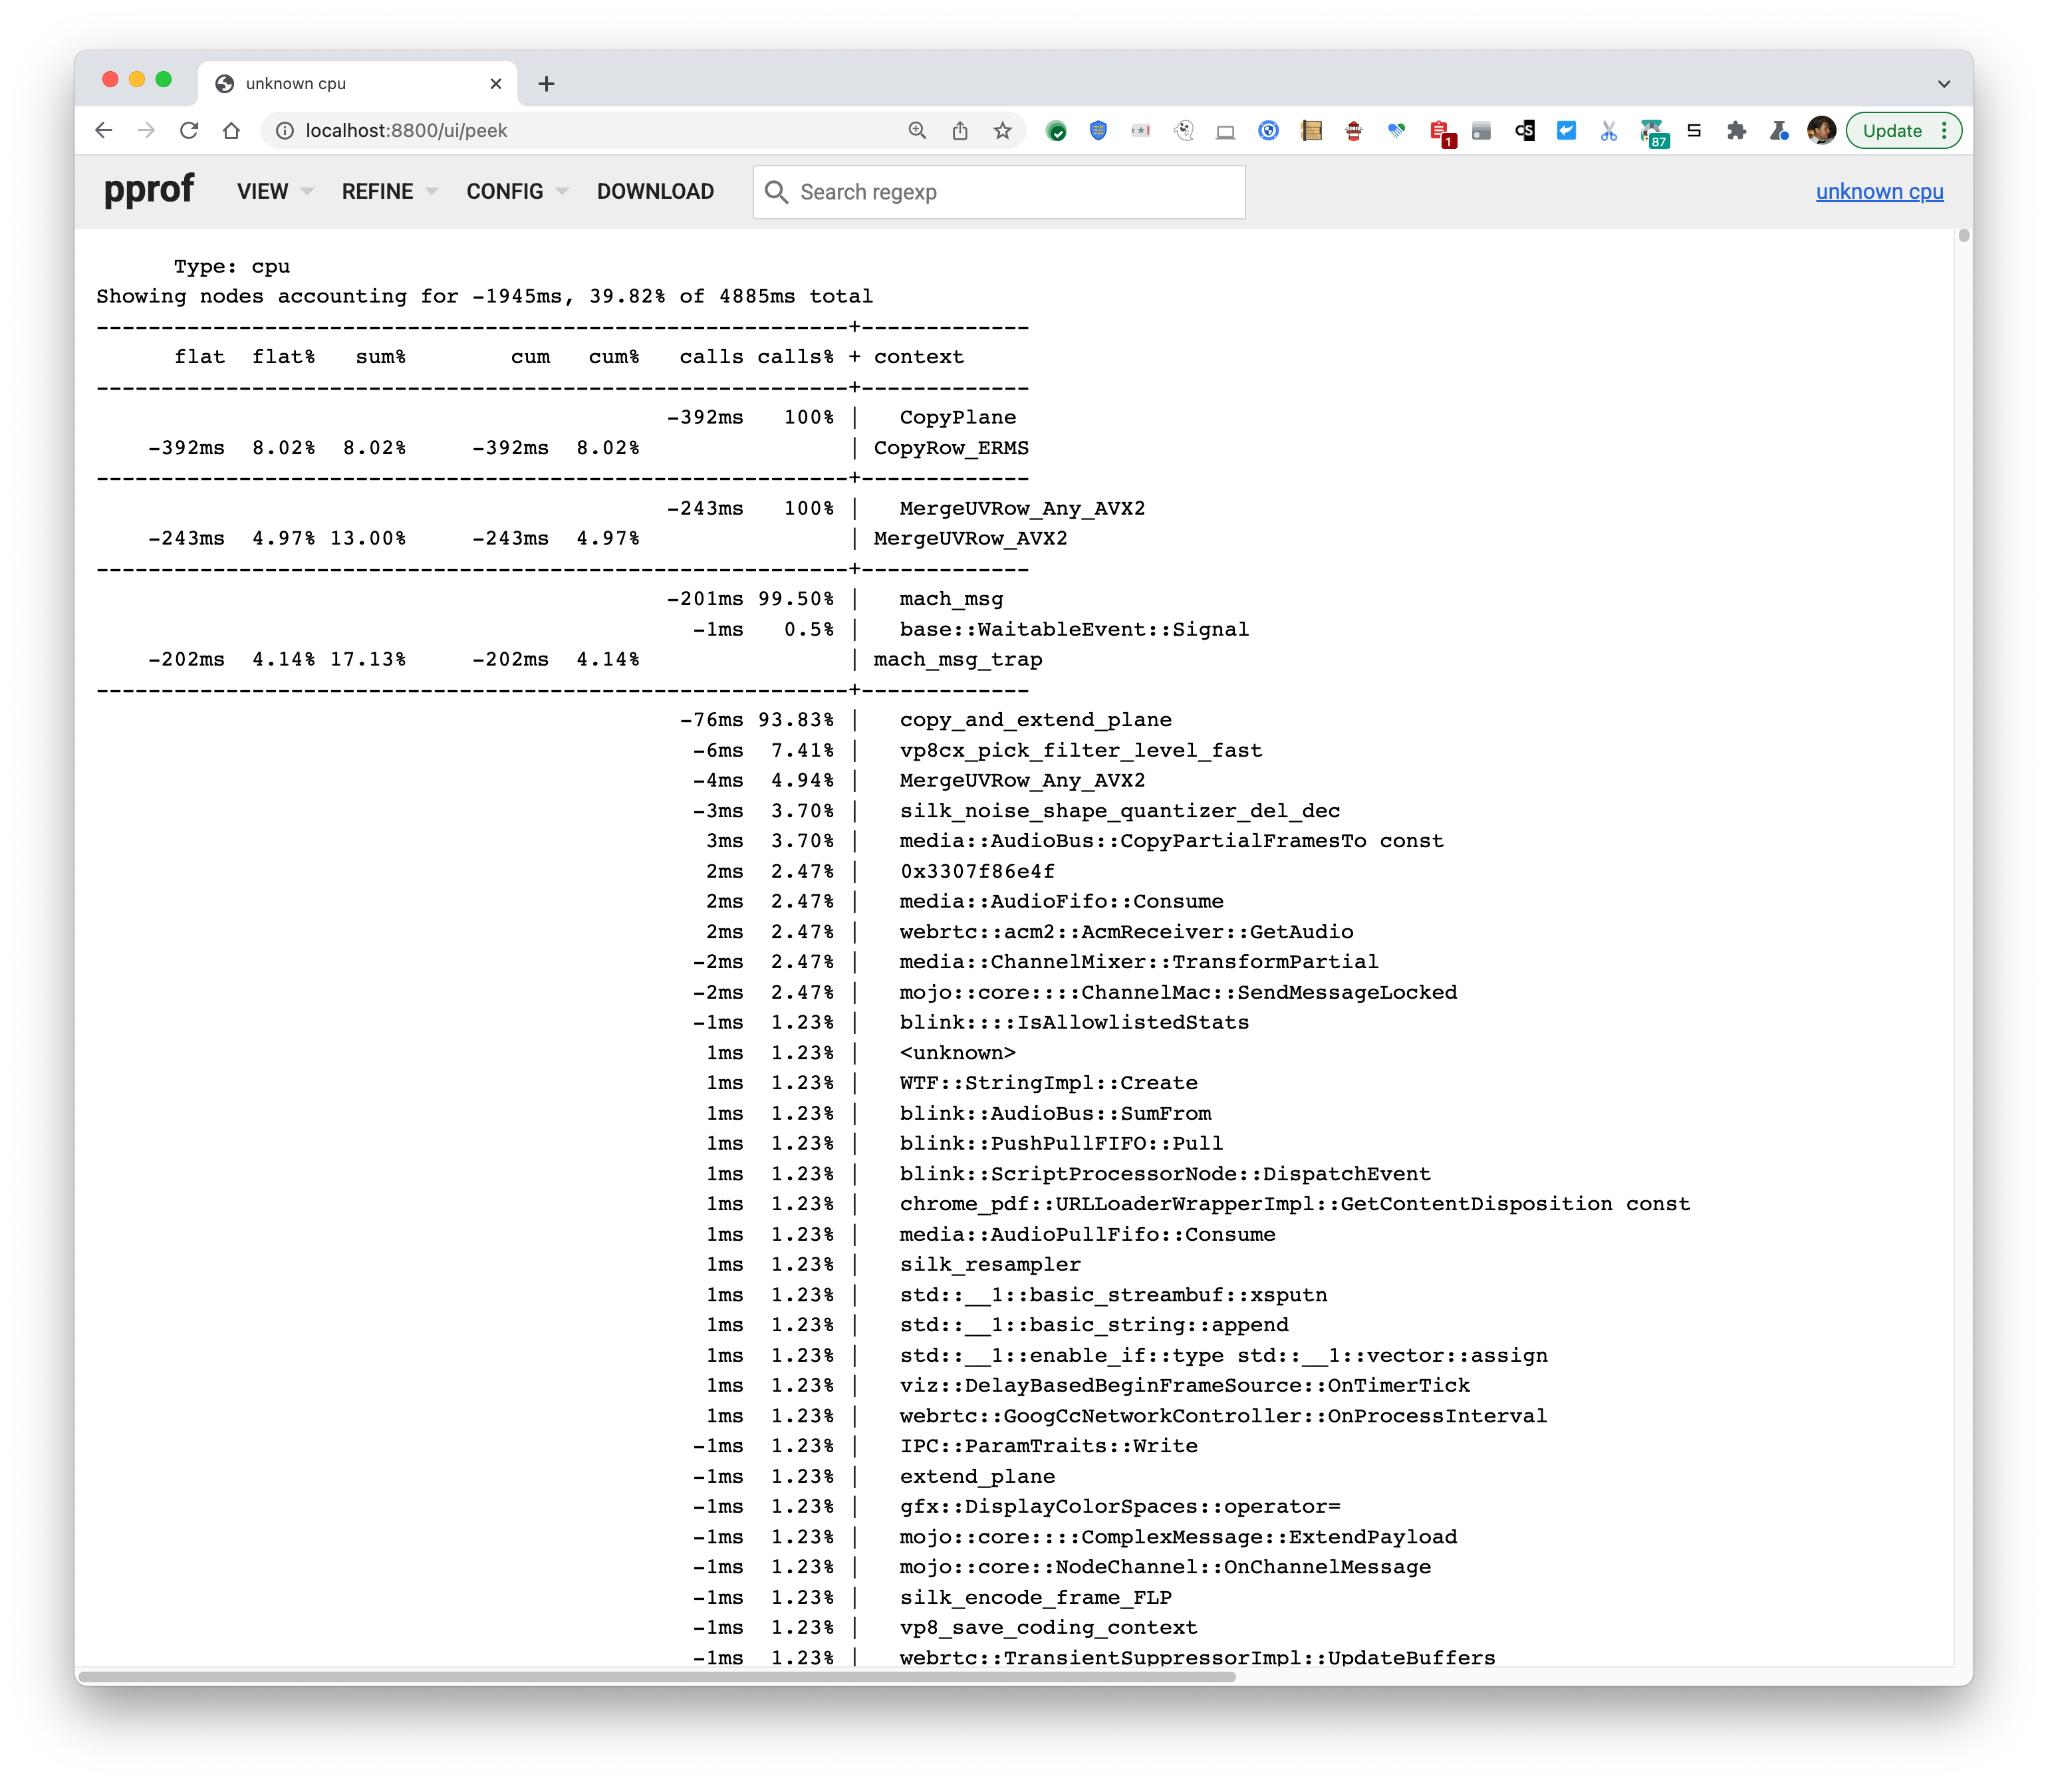 It reveals that VP8 encoding and
 I420→NV12 image conversions are largely gone under the change, and there’s less mach_msg IPC and activation of the GPU process.
pprof and idle wakeup profiling
Let’s turn to the topic of trying to find sources that cause the processor to wake up from sleep. This is a little trickier and we only have solutions for Mac and Windows at the moment.
Windows
As described above, Windows has a subsystem called ETW, for which probe actions are specified on the command line, and probe invocations are subsequently recorded into ETL files.
It turns out that Idle wake-up information can be deduced from the information logged on context switches. Each context switch has a waking thread and an awoken thread together with lots of more information. If the context switch causes the processor to switch out of its Idle process, the processor leaves its power-save state and starts executing code.
What’s really nice about the Windows information is that it indicates when the waking thread is a Deferred Procedure Call (DPC), which is deferred processing after an interrupt. Interrupts are the only thing that can wake a whole processor package from sleep and is the most expensive form of wakeup since the processor package has shared circuitry with RAM controllers and what not which has to be running if any of the processors are running! This is the kind of wakeup that we want to reduce the frequency of.
Google’s WebRTC team member Henrik Andreasson has open-sourced a tool that can convert context switch data to pprof, and it is available at https://github.com/google/IdleWakeups. One traces context switches and ready thread information for a while. The resulting .etl is subsequently converted using the IdleWakeup tool:
|
1 2 |
> xperf -on PROC_THREAD+LOADER+DPC+CSWITCH+DISPATCHER -stackwalk CSwitch+ReadyThread && timeout 15 && xperf -d recorded.etl > IdleWakeups.exe -s .\recorded.etl |
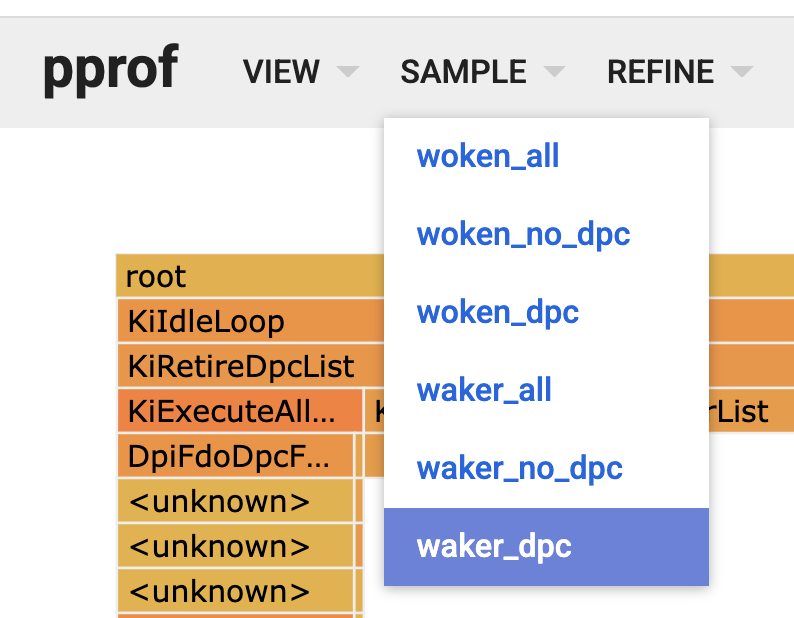
A nice feature of the tool is that we’re able to capture several dimensions of wakeup data in the same file. The dimension is selectable under the SAMPLE menu.
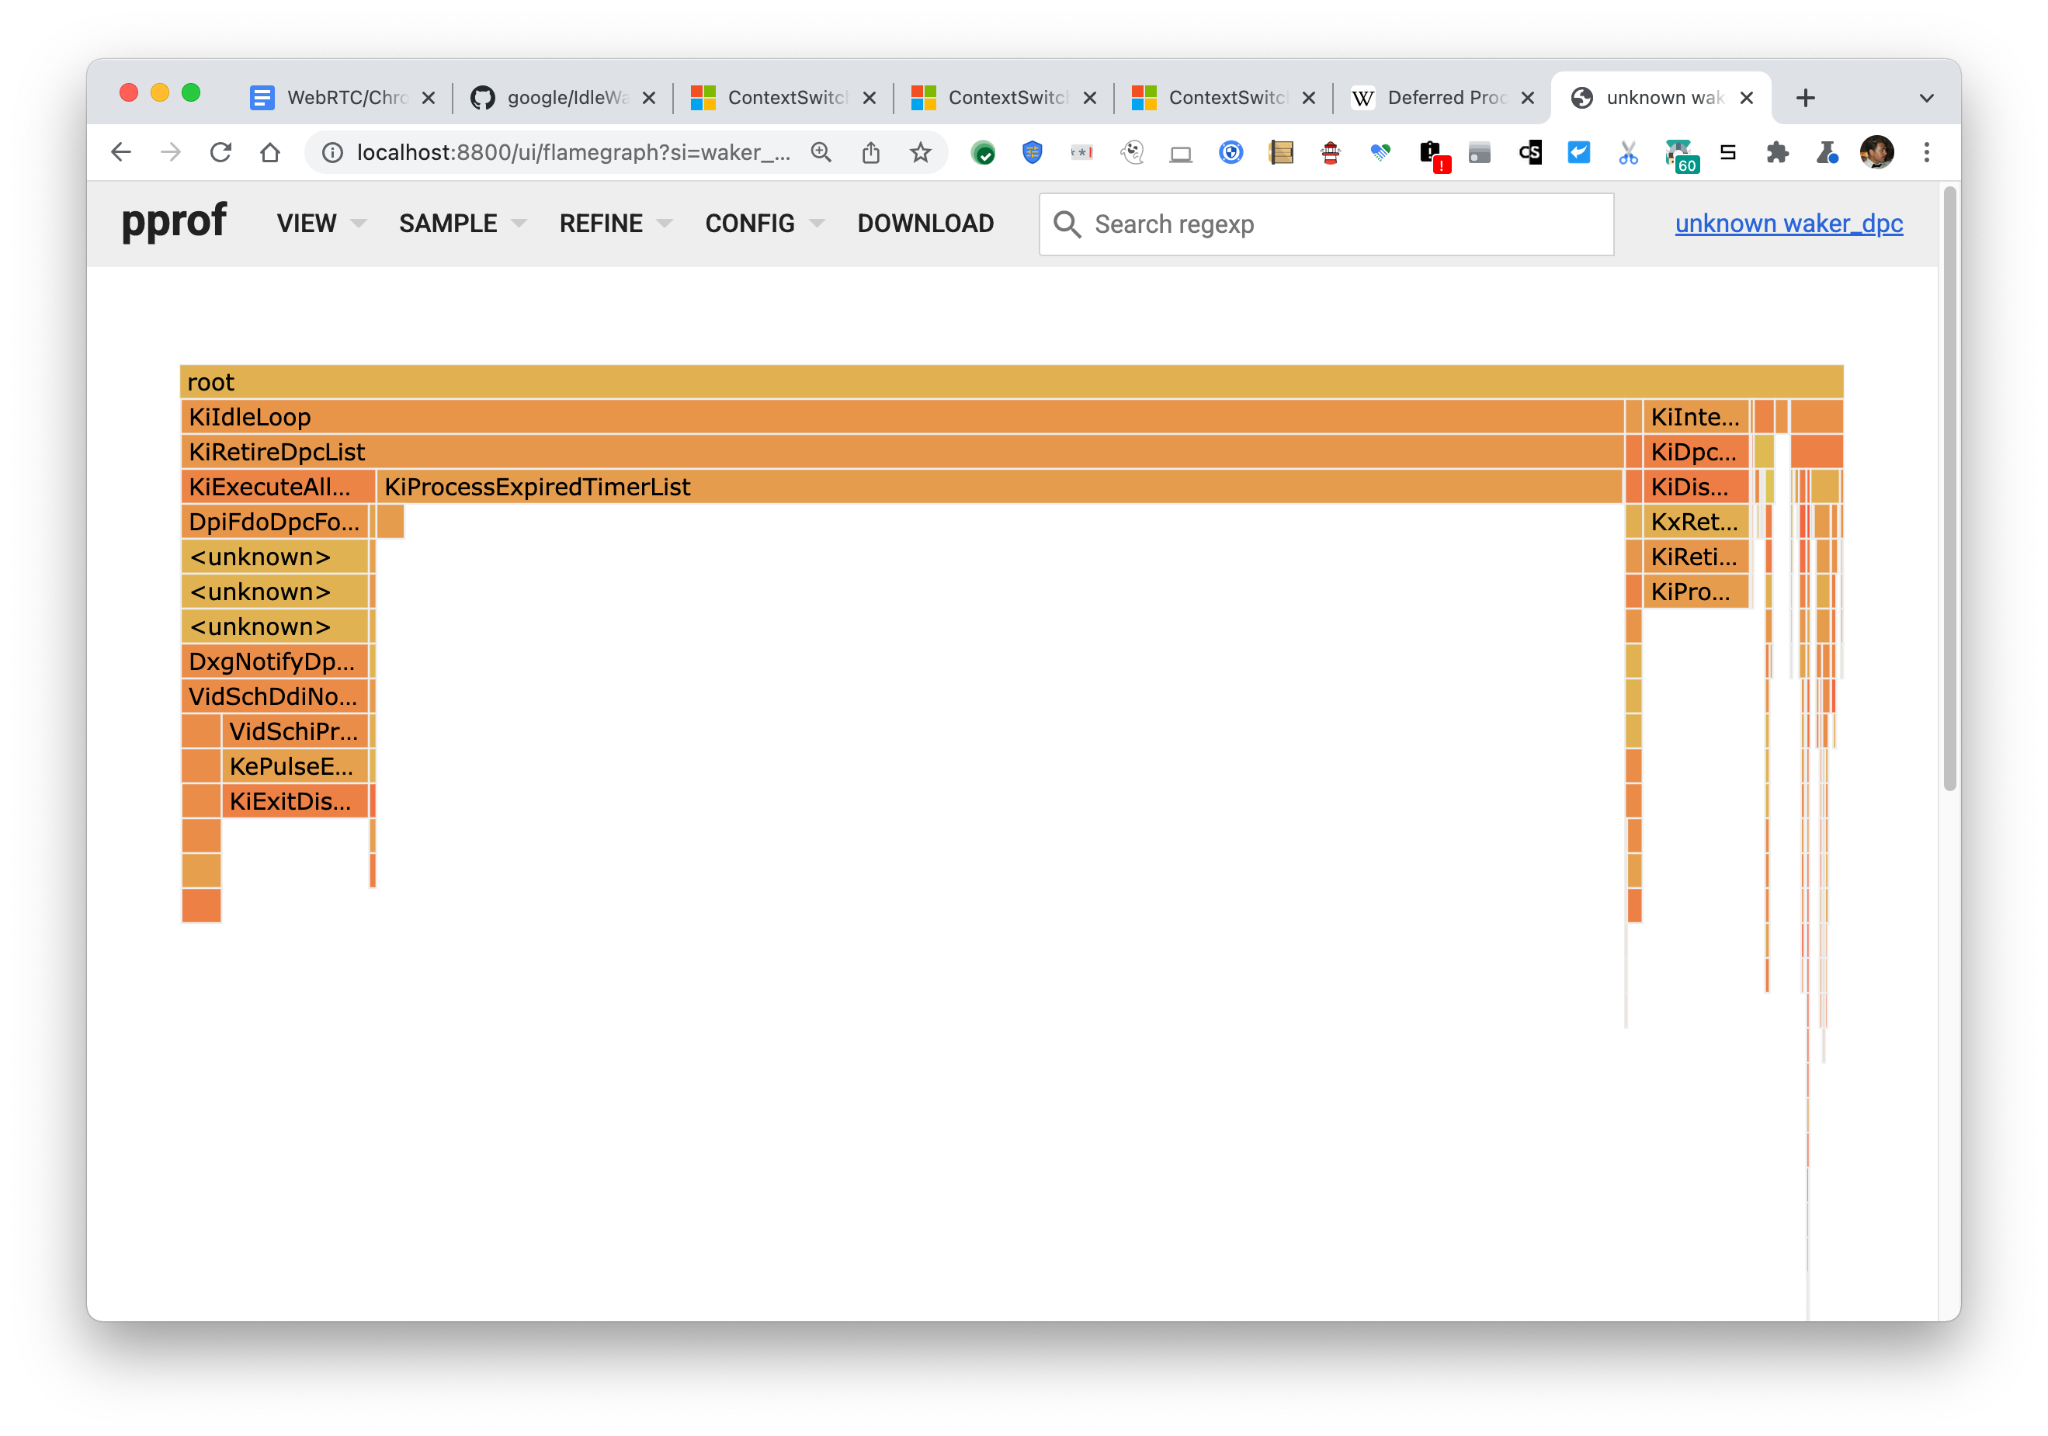
Viewing the DPC waker data reveals, like in the Mac section below, that a majority of the wakes happen due to timer interrupts, indicating that projects targeting the reduction of timer usage in Chromium/WebRTC would be impactful.
Mac
macOS has a great tool for tracing programs called DTrace. It enables the user to (note: disabling System Integrity Protection might be required) execute almost arbitrary code in user-specified probes in its own special language. Probes can be accessed through so-called providers, where the sched provider informs about scheduling events. Up until macOS Monterey, the sched provider almost follows the docs at https://illumos.org/books/dtrace/chp-sched.html. Due to a bug, the sched probes disappeared with macOS Monterey – if impacted, for the top-level analysis below and generic code refer to the Windows section above for an alternative.
The most up-to-date documentation is (as always) in the code. This time in sched_prim.c, turning out to have the following promising documentation above it’s iwakeup probe:
|
1 2 3 4 5 6 |
/* Obtain power-relevant interrupt and "platform-idle exit" statistics. * We also account for "double hop" thread signaling via * the thread callout infrastructure. * DRK: consider removing the callout wakeup counters in the future * they're present for verification at the moment. */ |
If the CPU package or a CPU is idle, unfortunately, we found we can’t sample user-mode stacks when hitting that probe, so it’s irrelevant for the cause of finding wakeup sources. But we can do an approximation to find stacks of awoken threads by tracking their evolution after sleeping, roughly following this definition:
- A thread entering sleep (
sched:::sleep) - And is not awoken by another thread (
sched:::wakeup) - And gets on-CPU (
sched:::on-cpu)
has performed a potential idle wakeup.
|
1 2 3 4 5 6 7 8 9 10 11 12 13 14 15 16 17 18 19 20 21 22 23 24 25 26 |
/* * Copyright 2021 Google LLC. * SPDX-License-Identifier: Apache-2.0 * iwakeups.d - profile potential idle wakeups */ sched:::sleep/pid==$target/ { candidate[curthread->thread_id] = 1 } sched:::wakeup/pid==$target/ { /* If the thread is explicitly awoken by another thread, this isn't an idle wakeup */ candidate[((thread_t)arg0)->thread_id] = 0; } sched:::on-cpu/pid==$target && candidate[curthread->thread_id]==1/ { @wakes["iwakeup: ", ustack()] = count(); } tick-1s { printa(@wakes); exit(0); } |
When I remove the condition that waking threads need to reside in the same process as $target, I get an empty set of stacks back. Why? It could be that the XNU kernel always wakes threads through other threads, and I’m unsure how to determine the original interrupt actor on Mac. I don’t know. But as stated, the script finds all IPC wakeups including ones external to Chromium and there are things to learn.
Running the output through the dtraceStacksToPprof converter tool (source) under a 50-person grid-view Meet call by issuing:
|
1 |
sudo dtrace -s iwakeups.d -p <chromium renderer pid> | dtraceStacksToPprof |
yields the following picture in pprof:
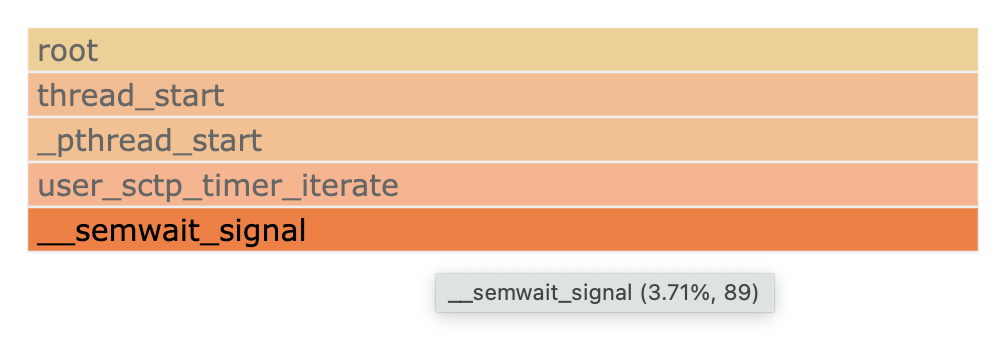
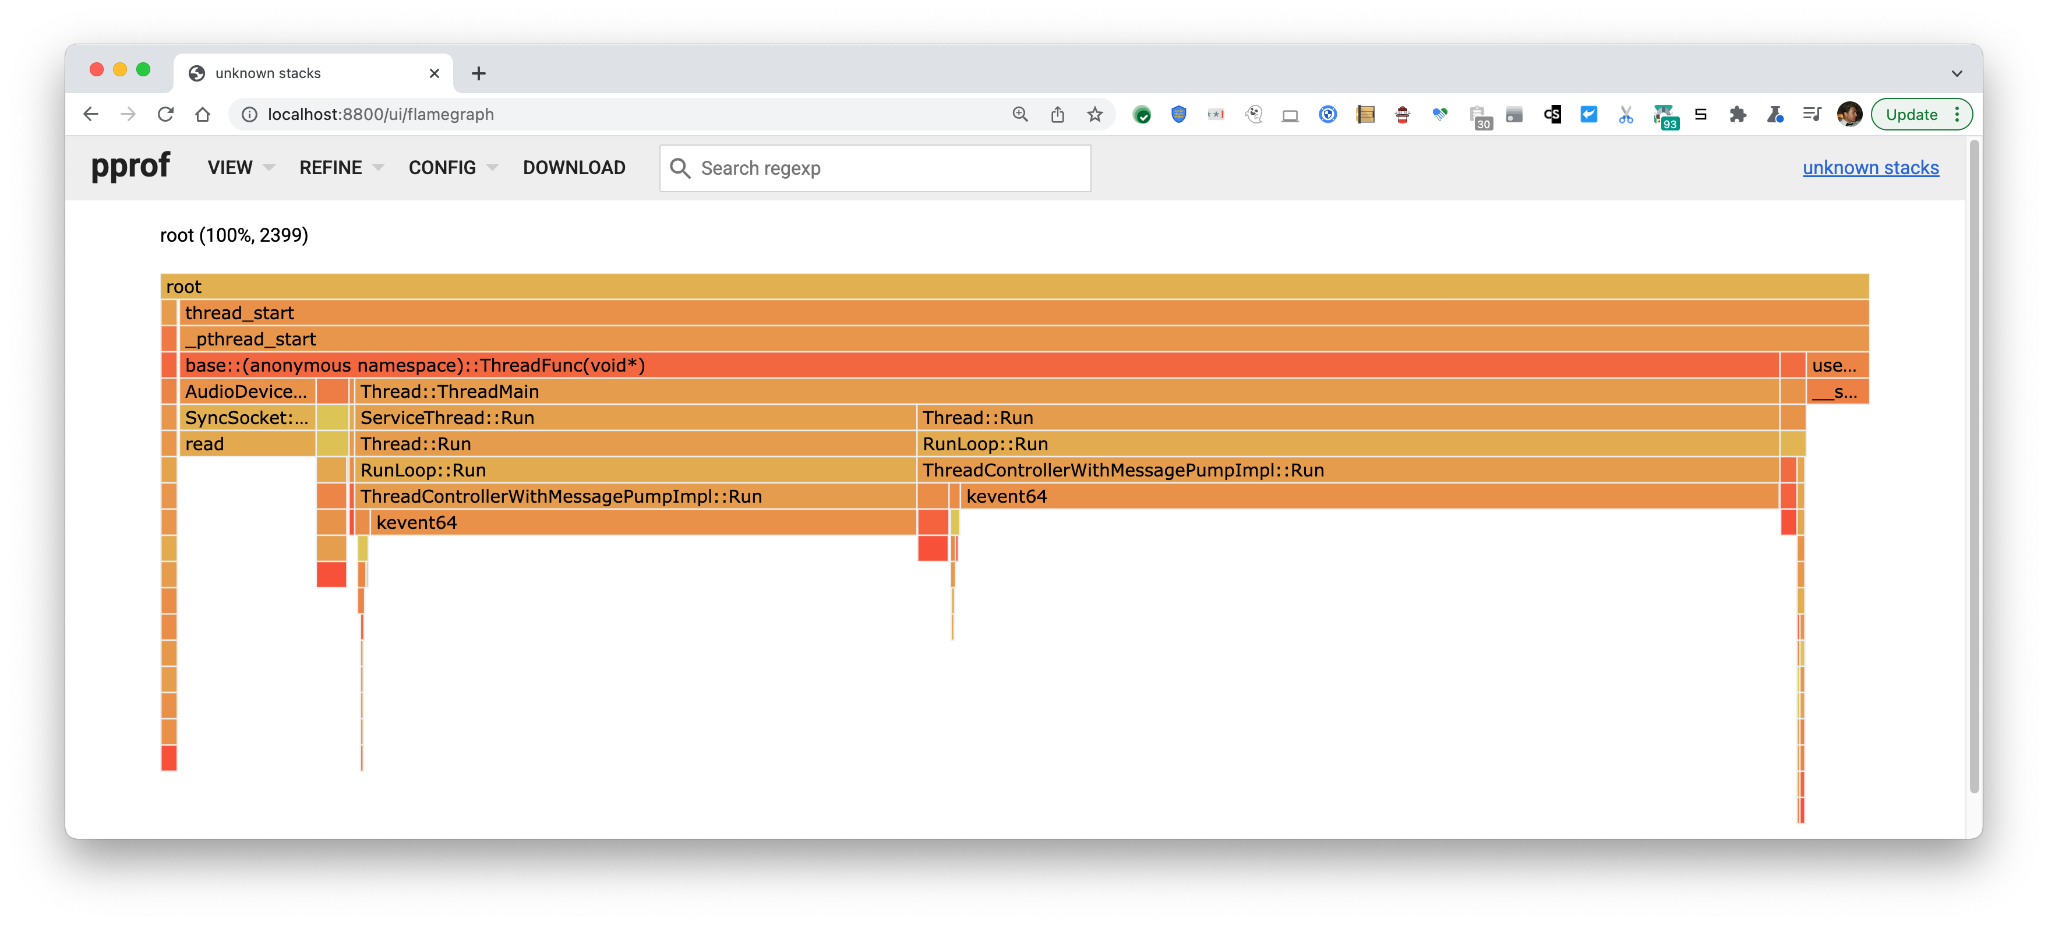 2399 of these pseudo wakeups are captured in 1s = ~2.4 kHz. To make ourselves more certain we are capturing wakeups we’re interested in with this script, let’s zoom in on the
 __semwait_signal stack where we see
89 Hz corresponds closely-ish (considering I just barged in and measured a second) to the 100 Hz usrsctp timer thread started here.
However, let’s not go for the small sources. One big source in this picture is the ServiceThread which is a framework component of Chromium’s (and WebRTC’s) way of scheduling delayed execution. To find the causes of these wakeups, we need to write a script that captures the callers of PostDelayedTask. This is easy to do with DTrace’s PID provider which enables probe code to be scribbled into a running binary:
|
1 2 3 4 5 6 7 8 9 10 11 12 13 14 15 16 17 18 19 20 21 22 23 24 25 26 27 28 29 30 31 32 33 34 35 36 37 38 39 40 41 42 43 44 45 46 47 48 49 50 51 52 53 54 |
#!/usr/bin/dtrace -s /* * Copyright 2021 Google LLC. * SPDX-License-Identifier: Apache-2.0 * Usage: postdelayedtask.d -p <pid> <wait time> <trace duration> */ #pragma D option quiet #pragma D option defaultargs dtrace:::BEGIN { onetick = 0; wait = $1 != 0 ? $1 : 45; end = $2 != 0 ? wait + $2 : wait + 10; ticks = 0; } pid$target::*PostDelayedTask(*Location*OnceCallback*TimeDelta):entry { /* * TaskRunner::PostDelayedTask(base::Location, base::OnceCallback, base::TimeDelta); * base::TimeDelta is value containing int64 us. */ if (arg3 != 0) { @pdt["PostDelayedTask: ", ustack()] = count(); } } pid$target::*PostDelayedTask*Location*TaskTraits*Once*TimeDelta*:entry { /* * TaskExecutor::PostDelayedTask(const Location&, const TaskTraits&, OnceClosure task, TimeDelta delay); * base::TimeDelta is value containing int64 us. */ if (arg4 != 0) { @pdt["PostDelayedTask: ", ustack()] = count(); } } tick-1s /ticks == 0/ { printf("%Y: Starting tick counter.\n", walltimestamp); } tick-1s /++ticks == wait/ { trunc(@pdt, 0); printf("%Y: Starting to collect stacks.\n", walltimestamp); } tick-1s /ticks == end/ { printf("%Y: Stack collection complete.\n", walltimestamp); printa(@pdt); exit(0); } |
Note that the script has a cool-off period at the beginning, to allow for things to stabilize as the traced process stops while its symbols are being examined.
During a 16 person grid-view Google Meet call I captured the following picture:

As you can see, the lion’s share of utilization comes from FrameBuffer, a piece of the decode and render pipeline in WebRTC. The reader might also notice there’s an anonymous clump of timer invocations coming from RepeatingTaskBase, a WebRTC primitive for repeated execution. It can be profiled by similar scripts as the one we profiled PostDelayedTask with.
Similarly to time profiling, we can use the -diff_base functionality to perform A/B analysis. This is left as an exercise to the reader 🙂
Chrome tracing
The time and idle profiling measurement methods and tools shown above are powerful. But they show only aggregated information. Individual strange events are lost in the flood of the most commonly occurring events. Sometimes one is interested in debugging strange events happening.
Enter chrome://tracing! The tool gives detailed insight into what’s going on in the C++ layers of WebRTC and many other Chrome components. It can be used to identify what’s going on during interesting events like Janky display or other interesting behavior.
How to trace
The nice thing about Chrome tracing is that you don’t need anything except Chrome to use it. When you’re ready to reproduce your scenario, just
- Open chrome://tracing in a separate tab or window
- Click Record
- Edit categories
- Deselect all providers and select the WebRTC provider (you can also select other providers as well for more views into the system)
- Finally, click the Record button.
When you’re done reproducing, click the Stop button. A picture will emerge that you can use to find your event and draw conclusions on what’s happening. Just as an example of data, I’ve traced some seconds of a 1-1 Meet call and zoomed in on a legacy getStats call.
I encourage app writers to take a look at how their apps behave during the key scenarios. If you’ve never done this before, chances are you’ll find something that can easily be tuned!

In this case, we see that the synchronous getStats call invokes the internal WebRTC signaling thread, collects the info, and occasionally invokes the worker thread to supplement that info.
A real-world example of debugging network latency impact can be seen in bugs.webrtc.org/12840#c4 where I used chrome tracing, varying two local builds with two startup parameter sets creating test runs, traces, and an analysis. In this case, I happened to use local builds and Chromium startup parameters, but in reality, this type of analysis can be done whenever you have an A and a B version no matter how the runtime conditions of each condition set are created, i.e. across variations of application JavaScript code or similar.
Caveats with Chrome tracing
One small problem with Chrome tracing is that probes have to be inserted manually into the software by a chromium developer, which means that pieces of processing may not be visible. So it sometimes doesn’t give a 100% accurate picture of what’s going on. Fortunately, if a previously un-probed piece of code is identified, it’s quite easy to add probes in C++ in a locally built version.
{“author”: “markus handell“}



Leave a Reply