As you evolve your WebRTC network you need ways to make sure it is working optimally. WebRTC is great that it comes with a low-level getStats method, but unfortunately this API needs a lot of aggregation and analysis before it is useful. A good example I ran into recently is calculating true, end-to-end latency between two WebRTC endpoints when you have one or more Selective Forwarding Units (SFUs) in between to relay the traffic. Starting way back in the analog telephone era, the ITU has recognized latency between the speaker and listener as a critical aspect of call quality. Current stats encapsulate this in a metric known as Round Trip Time (RTT).
How do you get end-to-end RTT? You’ll need some extra tools beyond getStats. One such tool that I have helped with that is aimed at helping with the aggregation and analysis needed to answer problems like this is the open-source project ObserveRTC. Balázs Kreith is co-founder and lead maintainer of the project, PhD, and WebRTC software engineer. He put together a post to discuss how to calculate end-to-end RTT using a system like ObserveRTC. Then he went even further with a simple Docker-based walkthrough for calculating end-to-end RTT in an SFU environment that you can get running in minutes. I asked about how this would work in a cascaded SFU environment, and he even made an example for that! Read on for more details on RTT, end-to-end latency, and the walk-throughs.
Thanks to Gustavo Garcia for his technical review help.
{“editor”, “chad hart“}

Working with real-time communication systems is fun. Challenging. Frustrating. Exhausting. But mostly Fun! One of the biggest challenges, which also causes a lot of frustration, is to provide a reliable metric for the quality of the meetings. For me, answering the simple question of “How was the quality during meeting X?” is like asking a blind person whether the sky was cloudy yesterday. Hard to tell, because I did not see it.
I think I can confidently say engineers never directly see the vast majority of calls the system they are working on provides – customers might not enjoy having an engineer join every call. Yet we have to provide a reliable way to measure and improve service from quality. Though many dispute the metrics we should use for different calculations, one metric is almost always on the list: the Round Trip Time, or RTT representing the connection latency.
We can get RTT from the client-side JavaScript, but that does that mean we have the true end-to-end RTT from one client to another. If we use a media server such as MCU or SFU, then the RTT provided by browser stats is the RTT between the client-side and the media server – not to the other user. The situation becomes more complicated when media servers are interconnected and users are not connected to the same media servers. How do we calculate the end-to-end RTT in those cases?!
In this post, I write about how to extract, aggregate and represent RTT in peer-to-peer, peer-to-sfu, and cascaded-sfu environments using ObserveRTC open source tools.
WebRTC getStats Review
WebRTC’s statistics API, commonly known as getStats, is a set of various metrics exposed by WebRTC’s peer connection. It is also good for a bedtime reading if you have some trouble sleeping. Every MediaStreamTrack sent or received by a client-side WebRTC app goes through a RTCPeerConnection, hence metrics like the number of packets sent or received and much more are accessible through stats.
The easiest way to get an idea of what stats are available is to load up chrome://webrtc-internals and look through all the drop downs. Items in brackets [ ] are calculated. Everything else is derived from a stats report.
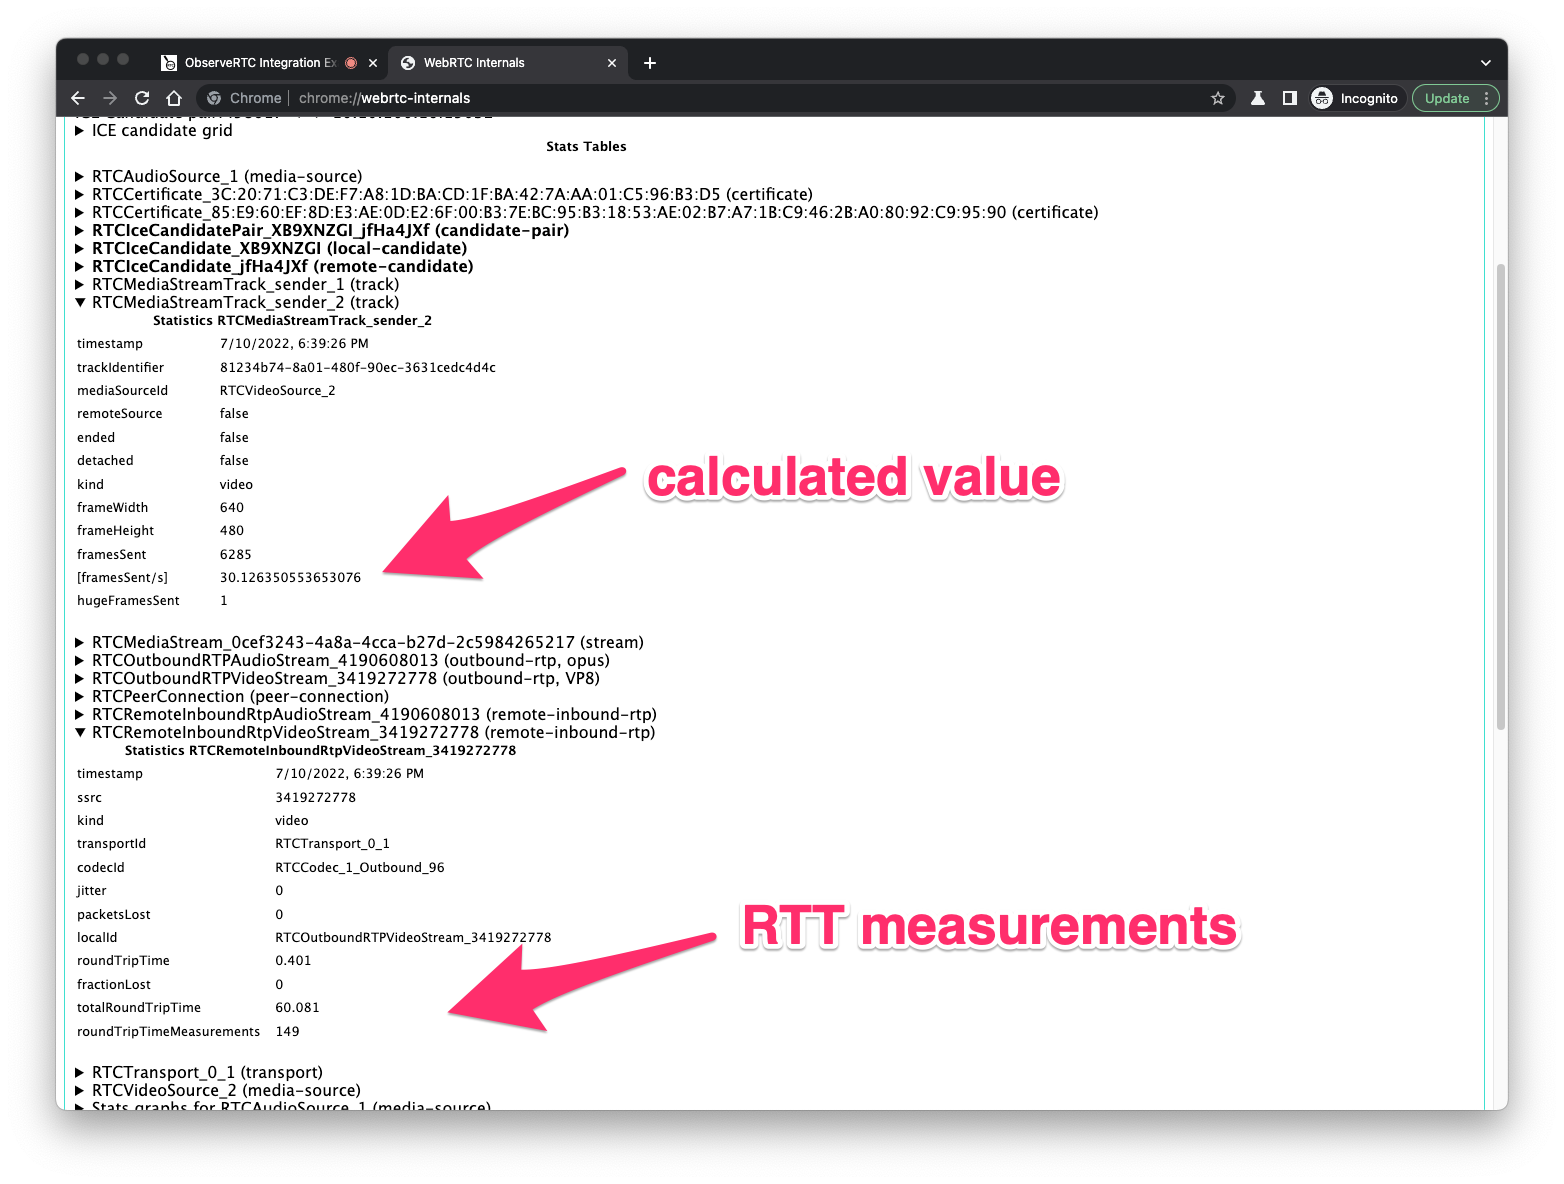
Getting RTT from getStats example
If we want Round Trip Time (RTT) we need to call getStats() on the peer connection and then look for one of the reports in the returned rtcstats object that has Round Trip Time. To see this yourself for a video stream, go to the official single tab WebRTC Peer Connection sample: webrtc.github.io/samples/src/content/peerconnection/pc1/. Click start to start your camera and then click call. This WebRTC sample exposes the RTCPeerConnection objects in the console.
|
1 |
pc1.getStats().then(reports=>reports.forEach(report=> {if(report.id.includes('RTCRemoteInboundRtpVideoStream')) console.log(report.roundTripTime) })); |
You should see a response of 0.001 or some other very small value since your peer connection doesn’t need to leave your computer.
Most stats need some aggregation
Getting these stats is easy. Making meaningful metrics out of them is often not. Meaningful metrics usually come with some sort of aggregation of the stats. For example, to calculate the sending bitrate of tracks we need to first filter out the appropriate track – either via the peer connection or the sender stats. From that grouping, we can extract the number of total bytes the track’s corresponded RTP source has produced. Then to get the actual sending rate, we need to subtract the difference from each report and divide it by the time period between reports.
Going back to webrtc.github.io/samples/src/content/peerconnection/pc1/, you can paste the code below to see how this works:
|
1 2 3 4 5 6 7 8 9 10 11 12 13 14 15 16 17 18 19 20 21 22 |
let pc1Stats, ts, lastTs, bs, lastBs, bitrate; let statsInterval = setInterval(async ()=>{ // the sample sets pc1 to null on hangup if(!pc1 || pc1.connectionState !== 'connected'){ clearInterval(statsInterval); return; } // We know we want to look at pc1 pc1Stats = await pc1.getStats(); pc1Stats.forEach(stats => { // note: we know pc1 only has a single outbound video stream here , but is not always be the case if (stats.id.includes('RTCOutboundRTPVideoStream')) { bs = stats.bytesSent; ts = stats.timestamp; bitrate = ((bs-lastBs)*8)/((ts-lastTs)/1000); console.log(bitrate); lastBs = bs; lastTs = ts; } }); }, 1000); |
That should show a similar bitrate to what you see in chrome://webrtc-internals
Apart from iterating the stats and waiting for the promise you almost always need to navigate through each stats report. This was a very simplified example with only a single video track we were monitoring, but often you need to do additional filtering of several tracks. There are plenty of ways to do this as long as if you keep track of the various ids needed to correlate the various reports. For example, if you want to know the codec of a specific track you need to list the sender stats, from sender stats you have the codecId and and trackIdentifier, which you can identify in your next iteration. If you want to know the local ICE candidate of the ICE candidate selected for the transport you need to know the id of the selected candidate pair, then you know the local candidate id, and then you can filter the local candidate you want to use. So on, and so on.
End-to-end RTT when you have an SFU
Round trip time (RTT) is one of the most important metrics in real-time communication. RTT implies the latency between two clients, which is a crucial factor to give any estimation of the perceived quality.
When two participants join each other in a direct peer connection, the actual RTT between the two clients is the RTT provided by WebRTC stats.
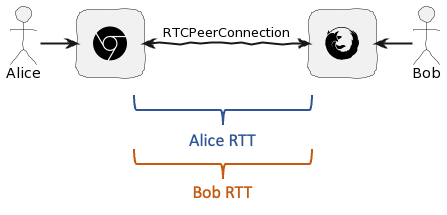
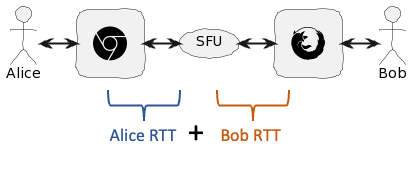
However, the more typical use case in modern WebRTC systems is to use a Selective Forwarding Unit (SFU) or Multipoint Control Unit (MCU) server to route streams between users. Each client would be connected to that server. In this case, the stats you get from each client’s getStats describe only the connection between the client and the server. In the example below, the true end-to-end RTT for Alice is the sum of the RTT from Alice to the SFU plus the RTT from the SFU to Bob.
Cascaded SFUs
To make the situation even more interesting, SFUs may be interconnected to each other. Each client joins the SFU nearest to them and the SFUs communicate to relay that traffic (also known as cascaded SFUs).

In this case, we also need to factor in the addition RTT between the SFU’s. One could come up with some sort of elaborate DataChannel ping mechanism for this. However, if you are collecting RTC stats from your SFUs already (which you should be), you just need to aggregate the RTTs measured by each client and add that to the SFU-to-SFU RTT. Once you have all that data in a centralized place, you then need to filter it for the correct call and then for the correct outgoing RTP stream.
So how do you do all that? Answering these difficult stats aggregation questions is one reason I started the ObserveRTC project.
ObserveRTC – an open-source tool for WebRTC stats
ObserveRTC is an open-source WebRTC monitoring tool. ObserverRTC collects stats from various monitors – client-monitor-js for your browser and sfu-monitor-js for Node.js-based SFU’s – and sends those stats to an observer instance for aggregation and storage coordination.
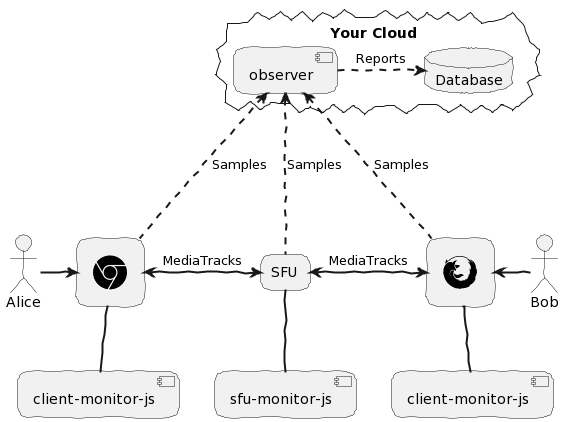
Add a scheme to getStats
The client-monitor acts like a wrapper for getStats with the benefit of using a hierarchical scheme to track the relationship between the stats instead of the raw getStats reports. For example, with this scheme, you can go from outbound-rtp you can go to the corresponding remote-inbound-rtp, or you can retrieve the trackId, or the transport, etc.
|
1 2 3 4 5 6 7 8 9 10 11 |
for (const outboundRtp of monitor.storage.outboundRtps()) { const { packetsSent, ssrc } = outboundRtp.stats; const trackId = outboundRtp.getTrackId(); const remoteInboundRtp = outboundRtp.getRemoteInboundRtp(); const { roundTripTime } = remoteInboundRtp.stats; console.log(`Track: ${trackId} ssrc: ${ssrc} RTT: ${roundTripTime}`); if (1.0 < roundTripTime) { // we have a round trip time higher than 1s } } |
See the full navigational diagram for the full scheme reference.
Aggregated Statistics
The observer receives samples from the various monitors. It then:
- Identifies meetings / calls
- Creates events (call started, call ended, client joined, client left, etc.)
- Matches clients’ inbound-rtp sessions with remote clients’ outbound-rtp sessions
- Matches SFUs RTP sessions with browser-side clients’ in-, and outbound-rtp sessions.
- Matches internal SFU sessions
This data is output into a series of reports that extend the client-provided samples by revealing the relation with other clients. For example, an inbound video track report is based on an inbound video sample but extended with stats data from the remote client that is sending that stream. Additionally, every report has a callId to help identify the meeting / call the clients were in.
The best way to learn how to use ObserveRTC is to run it in practice. For that, we created the full-stack-example repository. In the full-stack-example the observer saves the reports to MongoDB. You can find examples to query MongoDB with Python Jupyter notebooks here (and explained in the next section).
Where to learn more
The project has many pieces, but the Docker images make it easy to get started. A deep dive into ObserveRTC is beyond the scope of this post, but you can learn more at Introduction – ObserveRTC. The references below will primarily focus on what is needed to solve the end-to-end RTT problem when you have an SFU.
Calculating end-to-end RTT with ObserveRTC
This section will provide a step-by-step walkthrough on calculating end-to-end Round Trip Time (RTT) using ObserveRTC.
Example Testbed
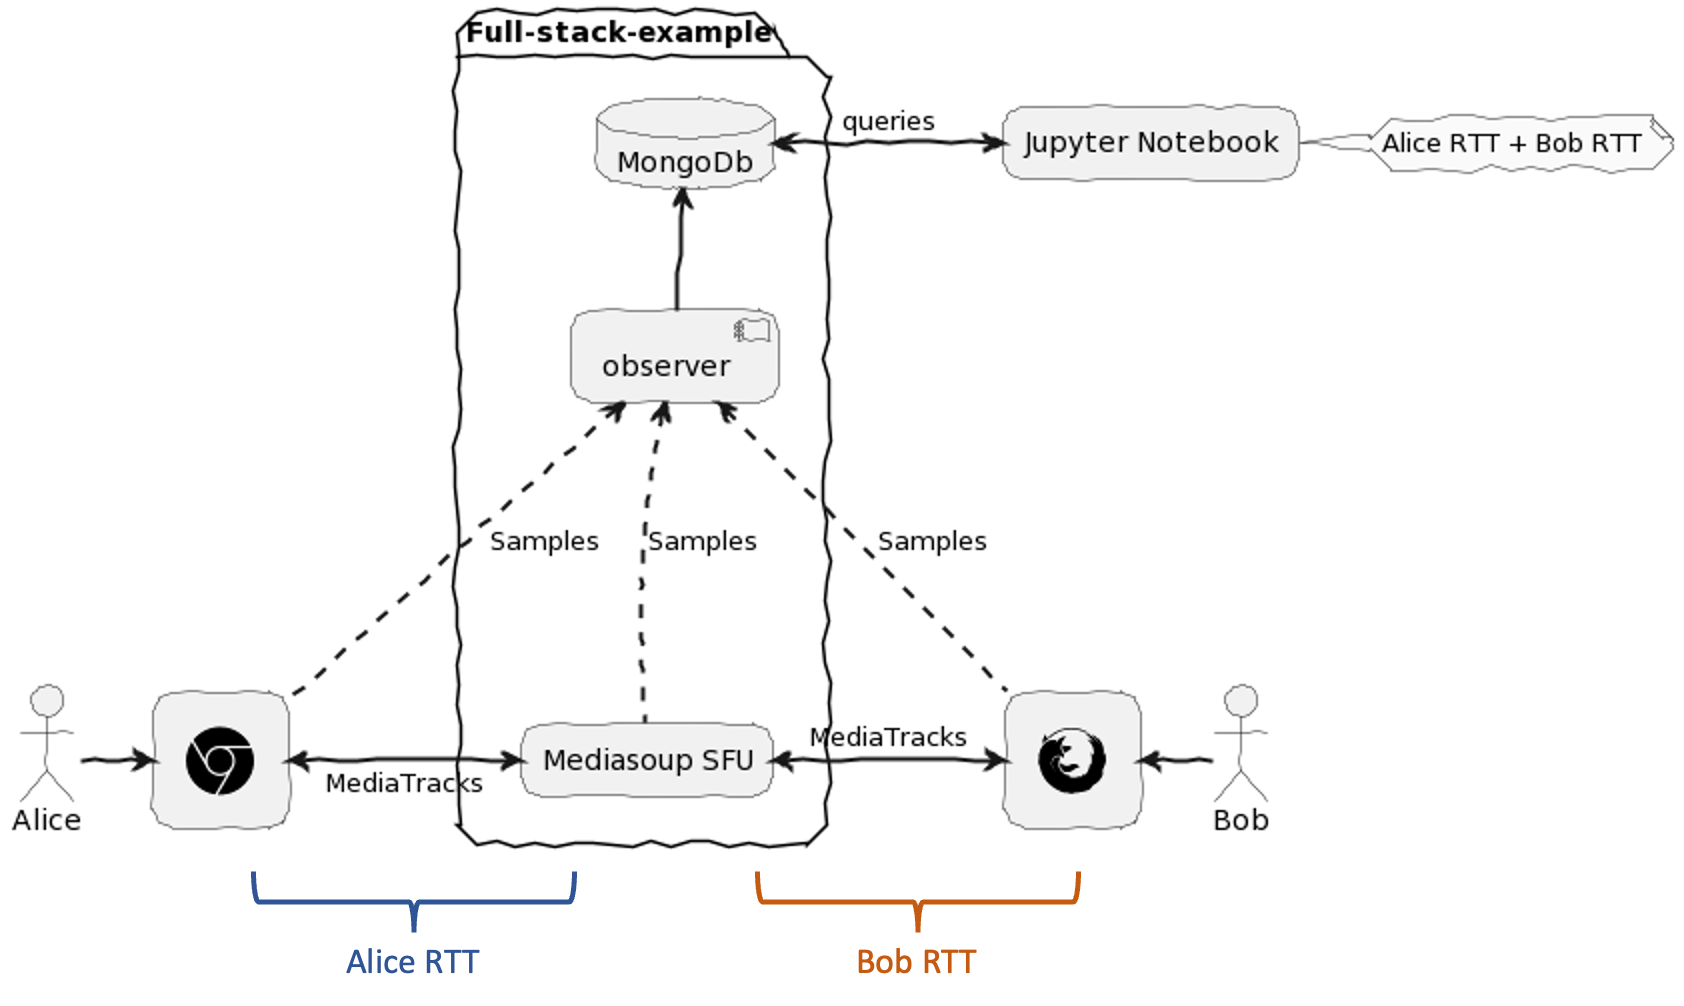
We use the ObserveRTC full-stack example repository to set up our testbed. The testbed contains a simple react app with a WebRTC browser client that includes client-monitor-js. The SFU is based on mediasoup, with its own sfu-monitor-js. The observer fetches a config from the observer-config folder, which configures it to send reports to mongodb. To simulate latency, we will use the Docker Traffic Control tool, docker-tc, with latency values set in environment variables.
Simple testbed setup walkthrough
First download the repo:
|
1 2 |
git clone https://github.com/ObserveRTC/full-stack-examples.git cd full-stack-examples |
Before we proceed, you’ll need to know the IP address your local network interface can reach the service running in docker from your computer. The SFU must announce an IP to clients where they can reach them. You can obtain it by typing ifconfig in macOS or Linux, or ipconfig in Windows. For local testing, it can be your LAN address – i.e. 10.10.0.50.
Now we know it, so let’s spin up our monitored webrtc stack with a
|
1 |
SFU_ANNOUNCED_IP={YOUR_LOCAL_IP} docker-compose up |
The command starts:
- my-webrtc-app: a single react browser side WebRTC app
- mediasoup-sfu: a single SFU the my-webrtc-app joins
- observer: the service listens for samples provided by the mediasoup-sfu and my-webrtc-app
- mongodb: a database for the observer reports
- mongo-express: a UI to query mongo.
- notebooks: jupyter notebook to analyze the saved reports
my-webrtc-app, and mediasoup-sfu configure and start the client-monitor-js and sfu-monitor-js respectively.
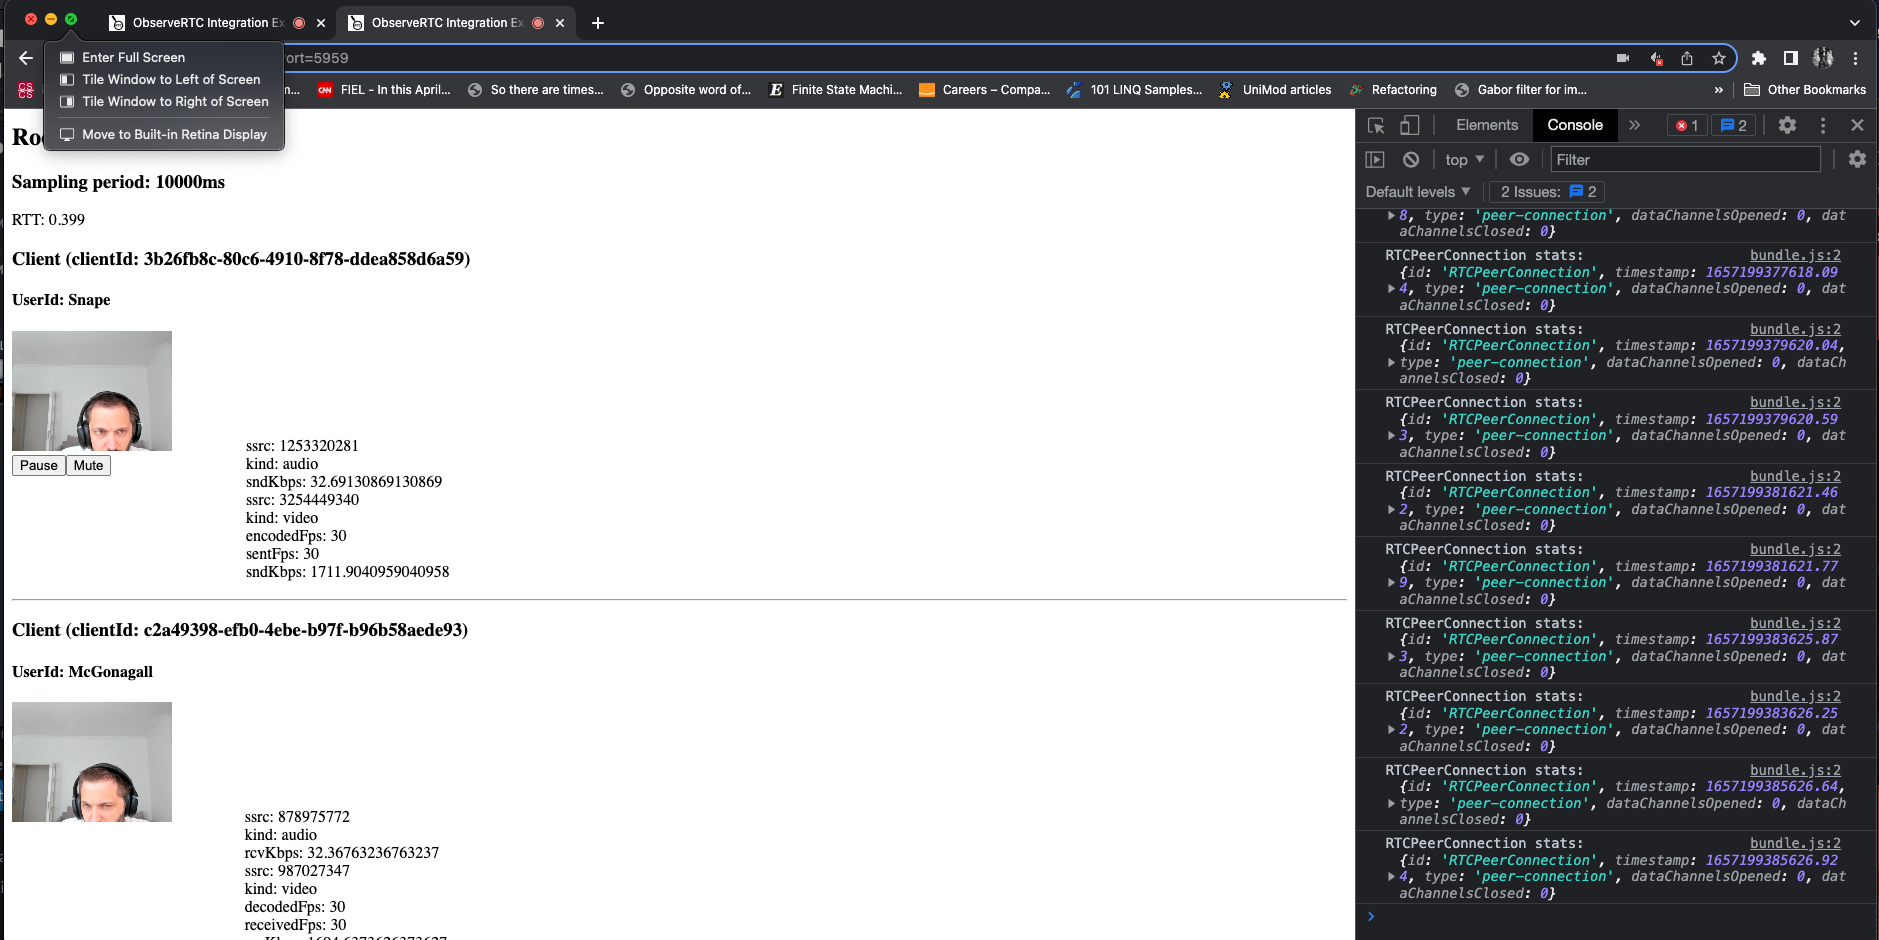
After it starts, go to http://localhost:9000 in two browser tabs and watch yourself. We recommend using Chrome as it allows ICE on loopback (here is a discussion to detail the issue in Firefox).
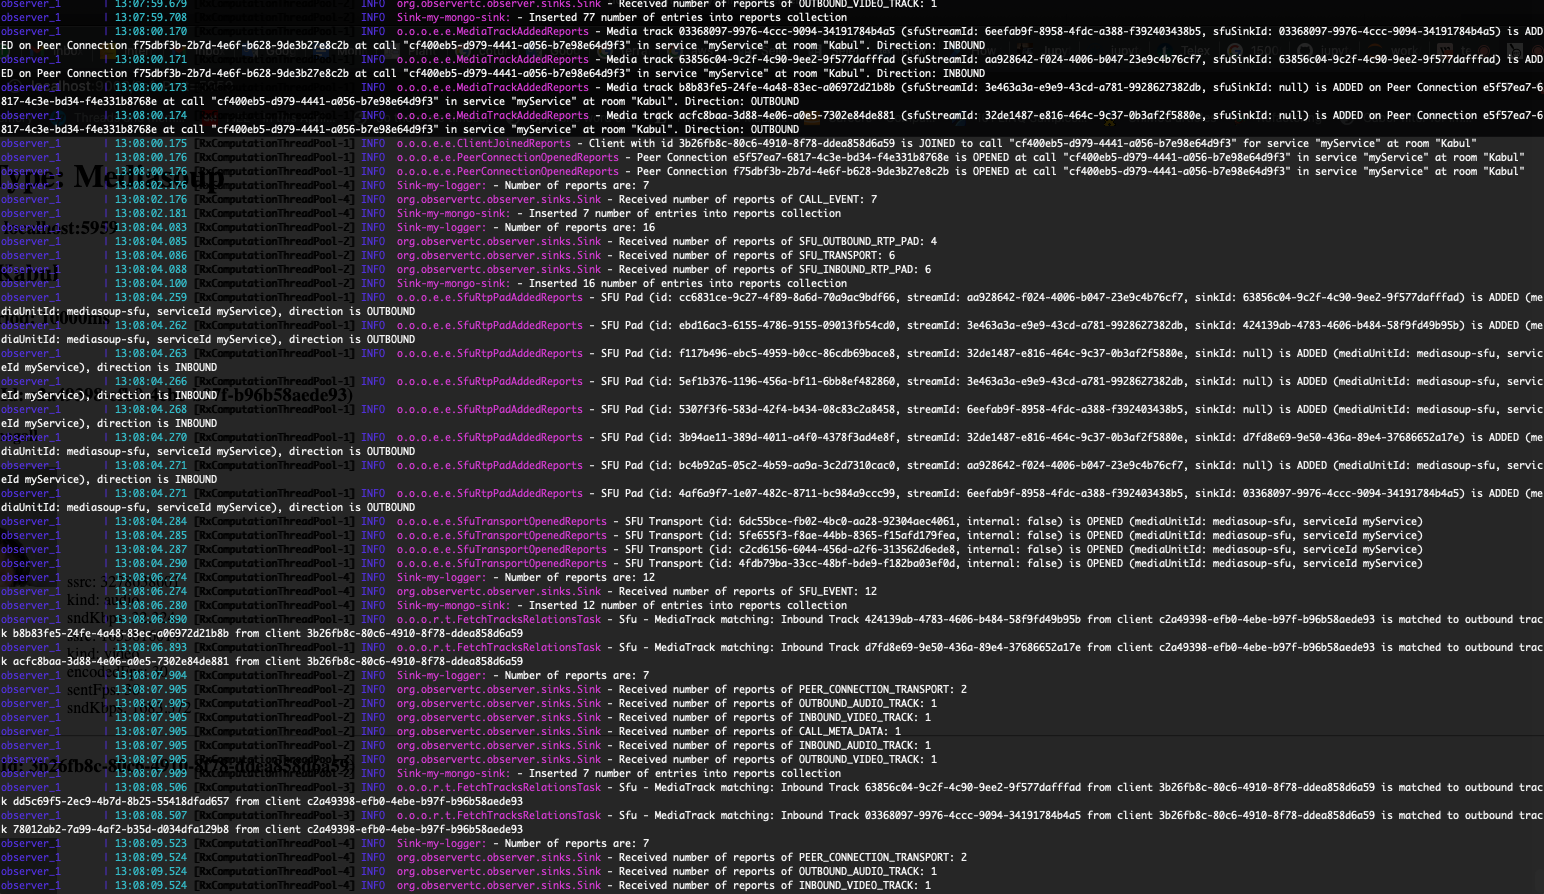
The roomId and userId are automatically generated. Wait a couple of minutes for everything to start. Meanwhile, if you check the logs of the Docker services, you will see observer detected the call and also informs about discovered relations between inbound, and outbound tracks, and SFU RTP pads.
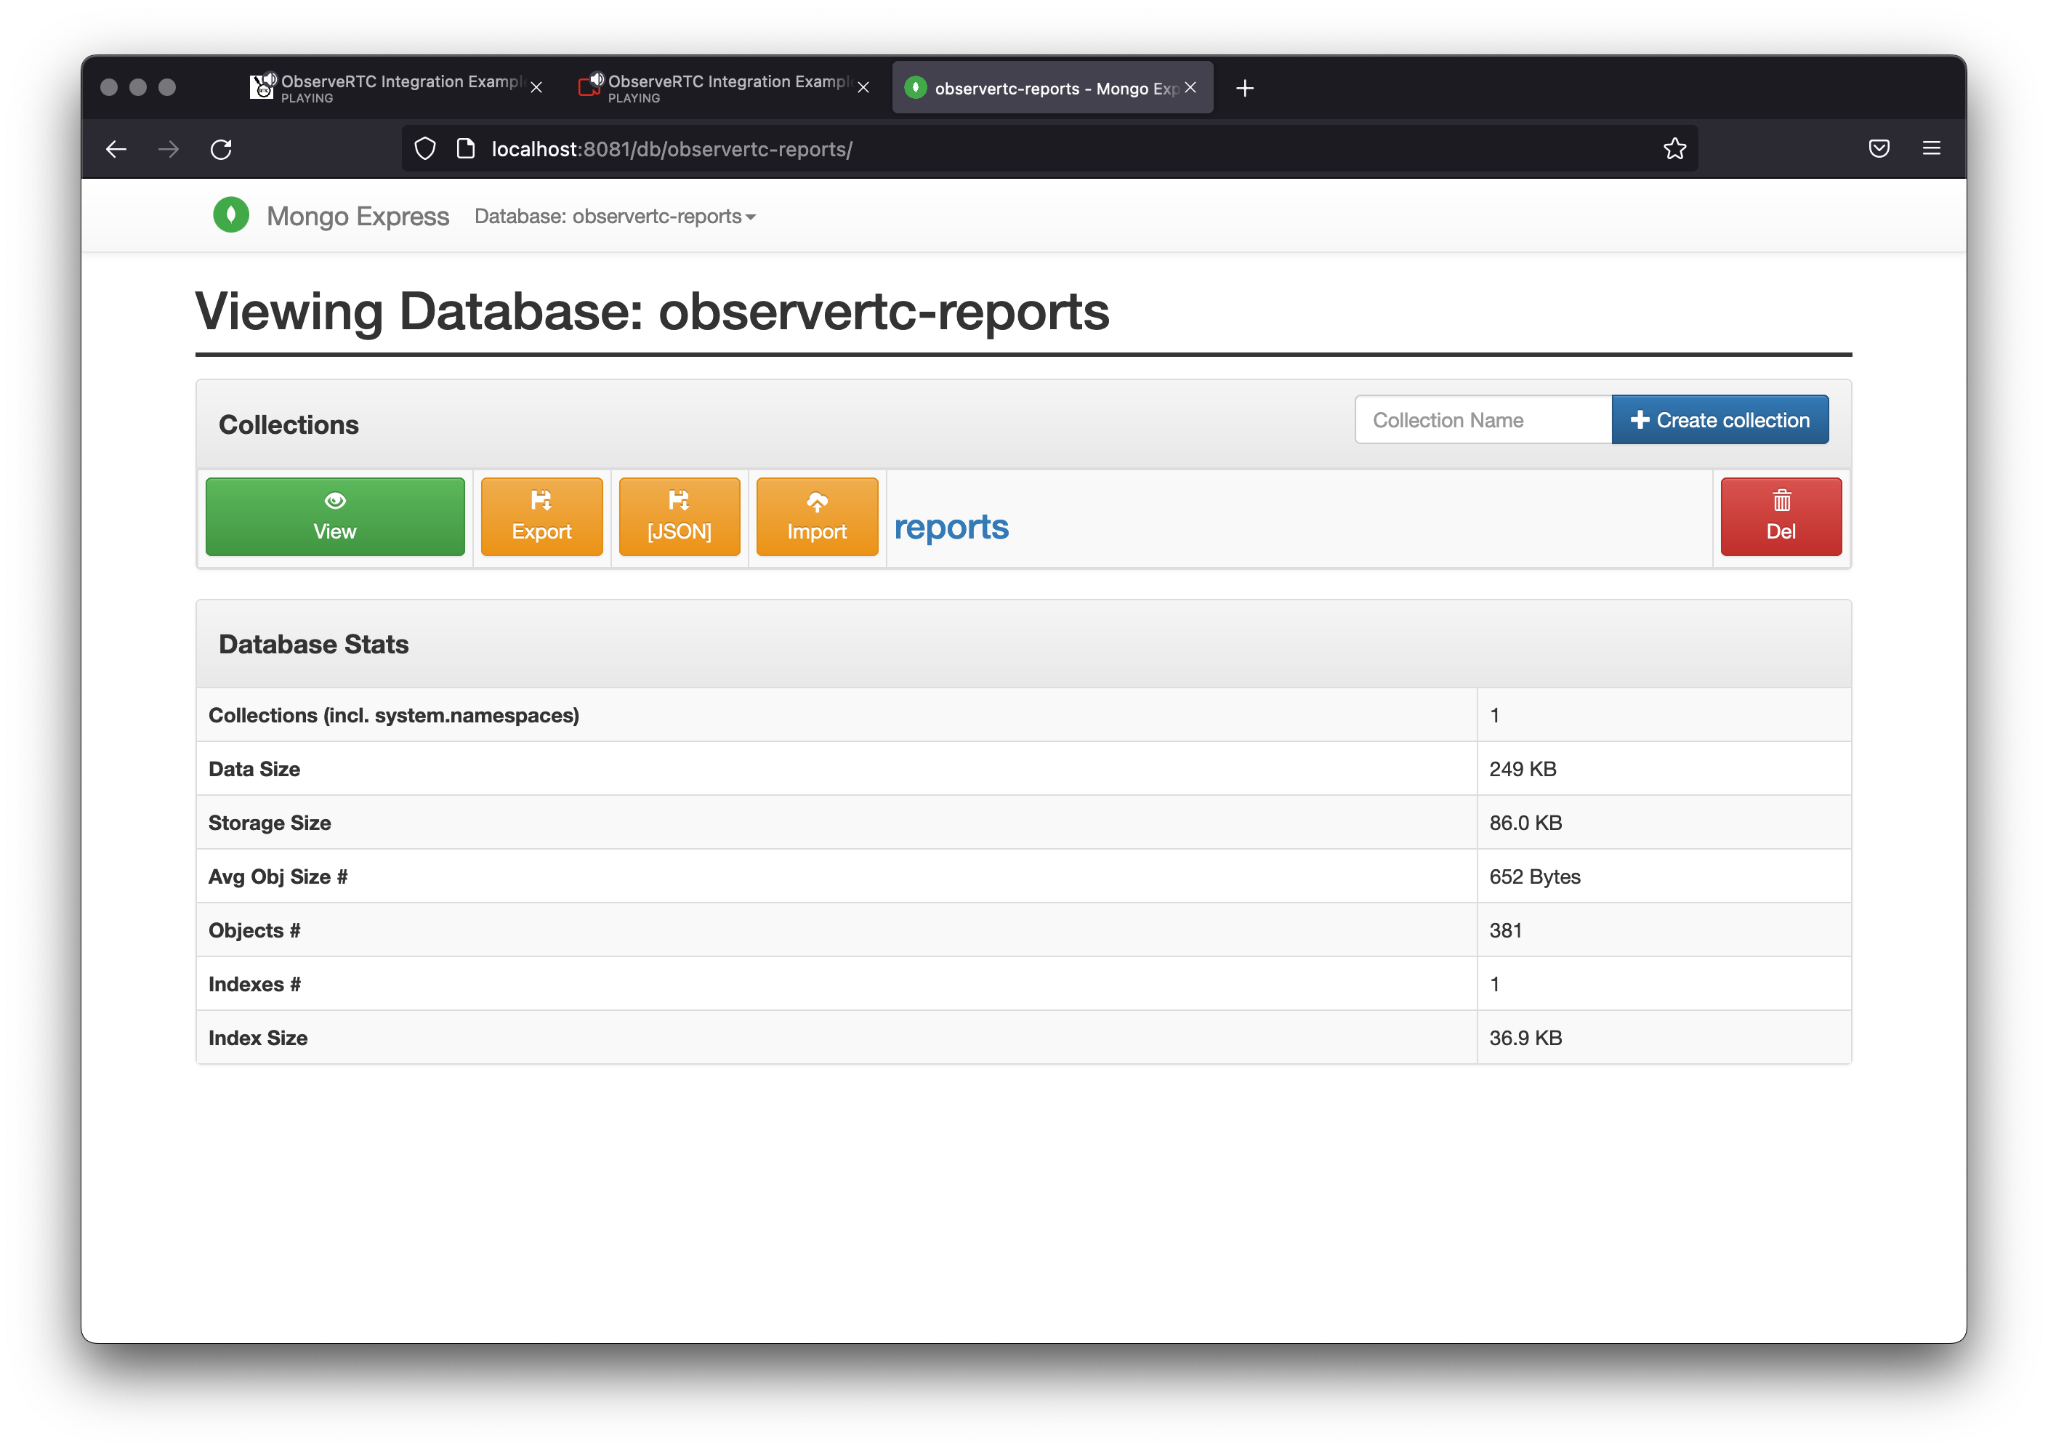
Go to http://localhost:8081 (admin/password) and check the observertc-reports database. You should see new data come in every 30 seconds – the default observer-to-database reporting frequency unless you change it.
Before we go to analyze the reports, take a look at the docker-compose.yaml file. There you can see an environment variable OUTBOUND_LATENCY_IN_MS under mediasoup-sfu service, and SAMPLING_PERIOD_IN_MS in my-webrtc-app. OUTBOUND_LATENCY_IN_MS controls the delay of the outgoing traffic by applying tc inside of the container. Though it sets the rules for the outgoing traffic, from the client perspective running on localhost that delay is the main factor for the RTT. In the webrtc-app section, SAMPLING_PERIOD_IN_MS controls the sampling time of the client-monitor to make samples.
ObserveRTC Reports
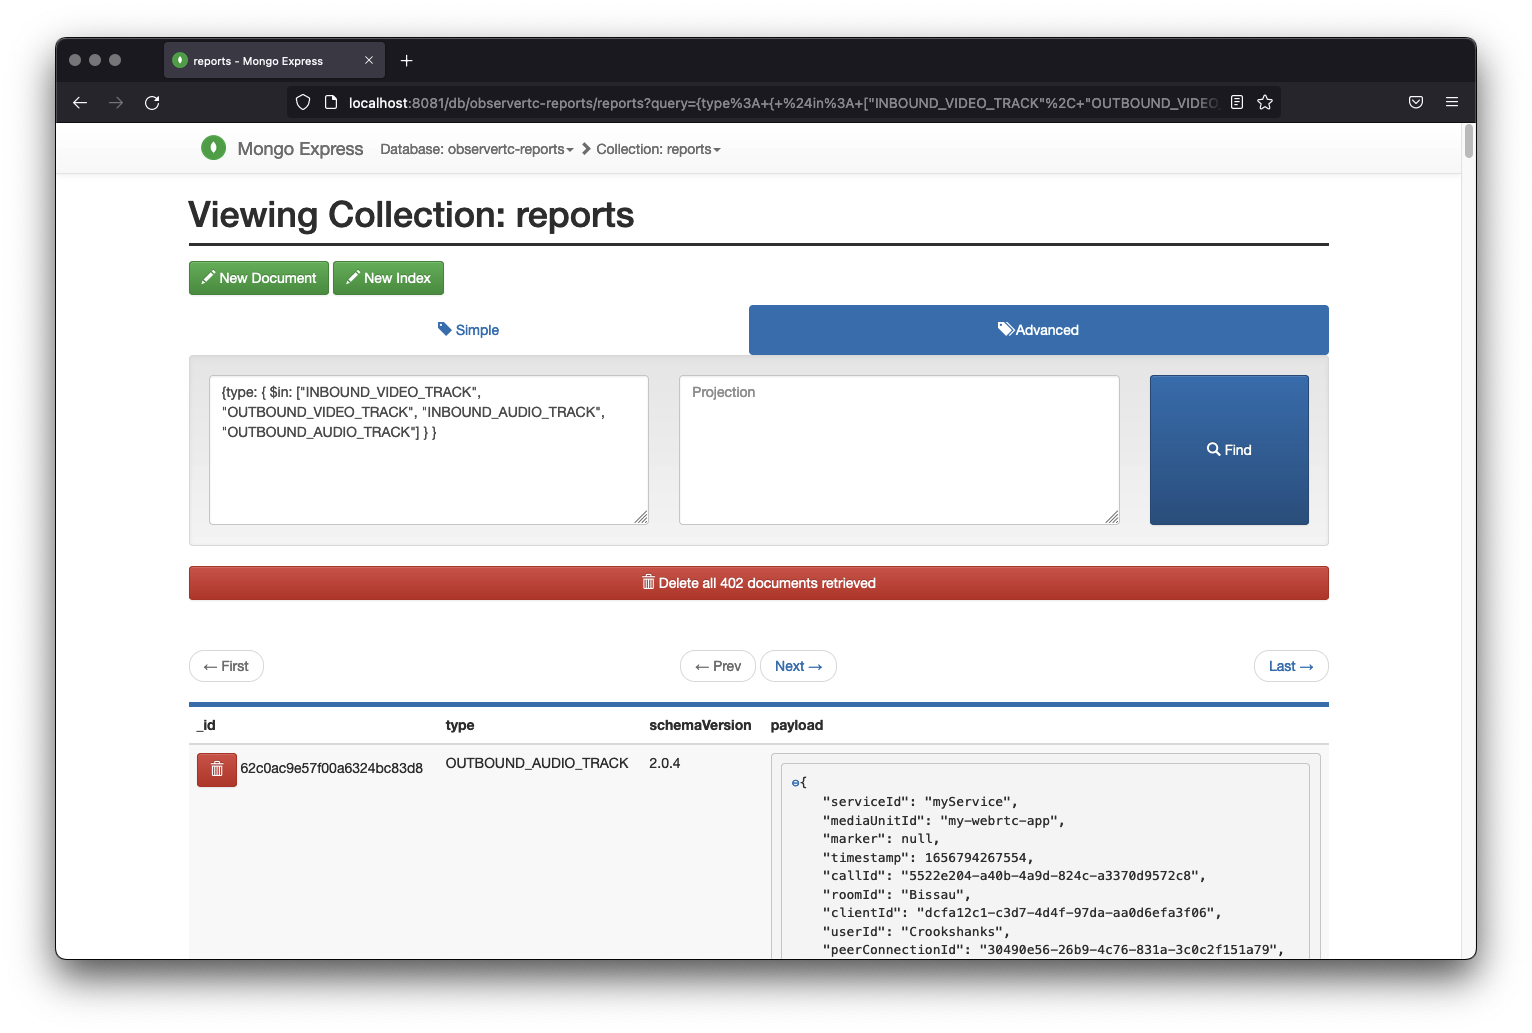
A Report forwarded to mongo has type, schemaVersion, and payload fields. The schemaVersion is for compatibility purposes, and the payload depends on the type. Different types of reports are for different purposes, here we will concentrate on the following type of reports:
OUTBOUND_AUDIO_TRACKOUTBOUND_VIDEO_TRACKINBOUND_AUDIO_TRACKINBOUND_VIDEO_TRACK
Apart from the corresponded stats received by the Observer, the service extends reports with information in order to identify which report belongs to which peer connection, client, and call.
Additionally, the inbound audio and video track reports have additional common fields:
remoteClientIdidentifies the client the track originated fromremotePeerConnectionIdidentifies the peer connection on the remote client that provides the outbound track this track receives the media fromremoteTrackIdidentifies the outbound track id on the remote clientsfuSinkIdidentifies an SFU subscription for asfuStream
You can investigate these values yourself in Mongo Express using the advanced search filter with {type: { $in: ["INBOUND_VIDEO_TRACK", "OUTBOUND_VIDEO_TRACK", "INBOUND_AUDIO_TRACK", "OUTBOUND_AUDIO_TRACK"] } } or using this URL in your browser.
Using ObserveRTC report values to calculate RTT
So how do we calculate the end-to-end RTT between two users?!
RTT measurements are reported as part of the OUTBOUND_AUDIO_TRACK, and OUTBOUND_VIDEO_TRACK reports. That is giving information on the RTT between the user and the SFU. INBOUND_AUDIO_TRACK, and INBOUND_VIDEO_TRACK reports have the outbound track id, the remote peer connection, and the remote client that published the media stream. Having these in hand for the client we want to track, we simply trace back and plot.
Collect RTT measurements and trace peer connections
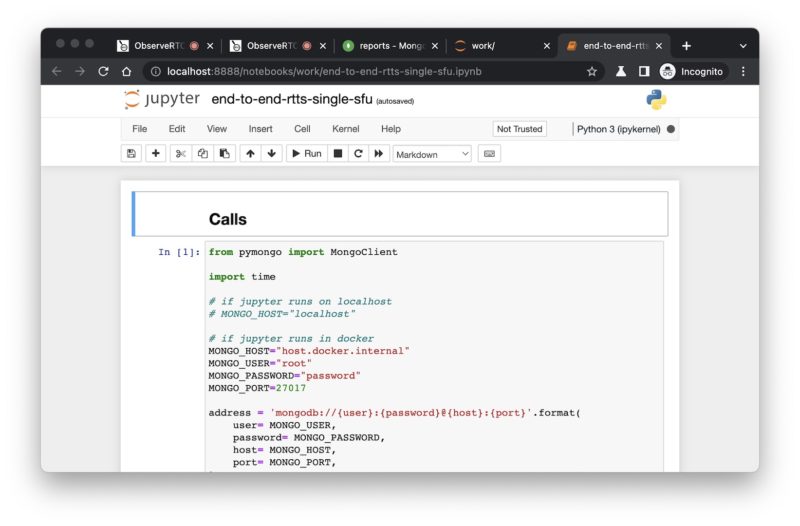
Maybe not so simple. I made a jupyter-notebook, available in the full-stack-examples, that calculates the end-to-end RTT between users, and I describe the process here. The Jupyter notebook runs as part of the docker stack and is available on http://localhost:8888
Clients create the samples periodically and asynchronously. This means for example if the client-monitor-js sampling period is 5 minutes then a sample at 12:00, and 12:05 are created Alice-side. Meanwhile, Bob-side samples are created at 12:02, and 12:07. Samples reported by Alice having the RTTs between her and the server, and Bob reported samples having RTTs between him and the server. We have multiple RTT measurements in one sample because all of the metrics of all the media tracks on all peer connections a client possesses are included in one sample.
In the notebook I linked above, the first cell is to list the calls and clients for each call. We will use these values to investigate one of them.
|
1 2 3 4 5 6 7 8 9 10 11 12 13 14 15 16 |
Room: Havana -------- Call 9699b873-beeb-4d7c-9694-9c08534a24b9 UserId: Nagini ClientId: e80ad6c2-0710-490c-92d9-91bed563cff6 Joined: 1656932609953 Left: 1656933704440 Duration: 18 min UserId: Rita Skeeter ClientId: 139fcaf6-4f46-4a66-abbe-3c65010503d3 Joined: 1656932622349 Left: 1656933694444 Duration: 17 min |
After we know who we are looking for, the next step is to collect RTTs between clients and the SFU and group it to peer connections. We group it by peer connections, tracks sent on the same peer connections use the same network transport.
|
1 2 3 4 5 6 7 8 9 10 11 12 13 14 15 16 17 18 19 20 |
peer_connection_rtts = {} # a mongodb pipeline pipeline = ... cursor = reportsDatabase.aggregate(pipeline) for report in cursor: payload = report["payload"] peerconnection_id = payload["peerConnectionId"] rtt_in_s = payload["roundTripTime"] timestamp = payload["timestamp"] measurements = peer_connection_rtts.get(peerconnection_id, []) measurement = (rtt_in_s, timestamp) measurements.append(measurement) peer_connection_rtts[peerconnection_id] = measurements # data check for id in peer_connection_rtts: print("Number of measurements to analyze on %s: %s" % (id, len(peer_connection_rtts[r]))) |
The next step is to make maps for tracing. First, we want to trace back local client peer connections receiving tracks to the remote client peer connections, which are sending them. Second, since only outbound video and audio track reports have RTT measurements, we also need to map which peer connection of which client sending to which remote peer connection of which remote client.
At least for me the latter sentence is a bit hard to digest, so let’s make an example with imaginary users Alice and Bob. Alice has two peer connections, one for sending tracks to the SFU and one for receiving tracks from the SFU. Let’s denote the two peer connections as alice_snd_pc, and alice_rcv_pc. Bob too has two peer connections for the same purpose – we will denote them as bob_snd_pc and bob_rcv_pc.

Only the sending – i.e. “snd” – peer connections have reports that include RTTs, so we need to find those RTT values in alice_snd_pc, and bob_snd_pc. We want to know the end to end RTTs of Alice receiving peer connection(s). Reports having information that alice_rcv_pc is connected to bob_snd_pc. At that point we know the peer connection Bob uses to send tracks, so we know Bob RTTs to the SFU he is connected to. But we also need to know the RTT of the peer connection Alice uses to send tracks to the SFU she is connected to. Thus we need to map which client uses which peer connection to send tracks to the SFU the client is connected to, because then we know the RTT between the remote client and the SFU the remote client is connected to, which is – hopefully – the same SFU the remote client receives peer connections on.
|
1 2 3 4 5 6 7 8 9 10 11 12 13 14 15 16 17 18 19 20 21 22 23 24 25 26 27 |
# a mongodb pipeline to select the outbound audio and video tracks for a call pipeline = ... cursor = reportsDatabase.aggregate(pipeline) for report in cursor: payload = report["payload"] client_id = payload["clientId"] client_peerconnection_id = payload["peerConnectionId"] remote_client_id = payload["remoteClientId"] remote_client_peerconnection_id = payload["remotePeerConnectionId"] if client_peerconnection_id is not None: inb_pc_ids = client_inb_pc_ids.get(client_id, set()) inb_pc_ids.add(client_peerconnection_id) client_inb_pc_ids[client_id] = inb_pc_ids if remote_client_id is not None and remote_client_peerconnection_id is not None: inb_pc_outb_pairs[client_peerconnection_id] = (remote_client_peerconnection_id, remote_client_id) client_remote_peers = client_outb_pc_pairs.get(remote_client_id, {}) client_remote_peers[client_id] = remote_client_peerconnection_id client_outb_pc_pairs[client_id] = client_remote_peers # data check for id in client_outb_pc_pairs: print("client_id:%s maps to the following remote_peer_ids: %s" % (id, client_outb_pc_pairs[id])) |
We create the following maps from INBOUND_AUDIO_TRACK and INBOUND_VIDEO_TRACK:
- client_inb_pc_ids maps a client and the peer connections it uses to receive tracks
- inb_pc_outb_pairs maps peer connections receiving tracks to the peer connection, which is sending them
- client_outb_pc_pairs maintain inner maps which remote client connects via which peer connections sending the tracks
Finally, we only need to sum the RTTs and plot them. We select the peer connections sending tracks to the SFU from each user. We sum up the RTTs between the two selected peer connections taken into account the timestamps when the RTT is measured.
|
1 2 3 4 5 6 7 8 9 10 11 12 13 14 15 16 17 18 19 20 21 22 23 24 25 26 27 28 29 30 31 32 33 34 35 36 37 38 39 40 41 42 43 44 45 |
client_to_client_rtts = {} for client_inb_pc_id in client_inb_pc_ids[CLIENT_ID]: remote_pc_id, remote_client_id = inb_pc_outb_pairs[client_inb_pc_id] remote_measurements = peer_connection_rtts[remote_pc_id] remote_client_peers = client_outb_pc_pairs[remote_client_id] client_outb_pc_id = remote_client_peers[CLIENT_ID] local_measurements = peer_connection_rtts[client_outb_pc_id] sorted_local_measurements = sorted(local_measurements, key=lambda x: x[1]) sorted_remote_measurements = sorted(remote_measurements, key=lambda x: x[1]) i, j, loc_size, rem_size = 0, 0, len(sorted_local_measurements), len(sorted_remote_measurements) end_to_end_rtts = [] timestamps = [] while True: if loc_size <= i or rem_size <= j: break local_client_to_sfu_rtt, local_client_actual_ts = sorted_local_measurements[i] remote_client_to_sfu_rtt, remote_client_actual_ts = sorted_remote_measurements[j] if i + 1 < loc_size and sorted_local_measurements[i + 1][1] < remote_client_actual_ts: i = i + 1 continue if j + 1 < rem_size and sorted_remote_measurements[j + 1][1] < local_client_actual_ts: j = j + 1 continue end_to_end_rtt = local_client_to_sfu_rtt + remote_client_to_sfu_rtt ts = max(local_client_actual_ts, remote_client_actual_ts) end_to_end_rtts.append(end_to_end_rtt) timestamps.append(ts) i = i + 1 j = j + 1 client_to_client_rtts[remote_client_id] = (timestamps, end_to_end_rtts) print("Average End-to-End RTT: %0.3f ms" % (sum(end_to_end_rtts) / len(end_to_end_rtts))) |
After that we can plot it.
|
1 2 3 4 5 6 7 8 9 10 11 |
import matplotlib.pyplot as plt for remote_client_id, remote_client_rtts in client_to_client_rtts.items(): x, y = remote_client_rtts fig, ax = plt.subplots() ax.set_title("end-to-end RTT between " + remote_client_id + " and " + CLIENT_ID) ax.step(x, y, linewidth=2.5) ax.set_xlabel('timestamps') ax.set_ylabel('RTT [s]') plt.show() |
It should look something like this:
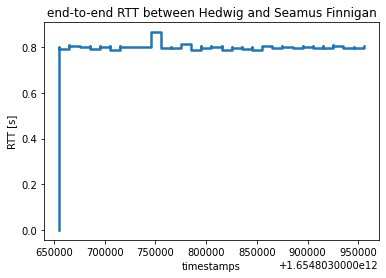
I set the default RTT between the SFU and connected clients to have 400ms latency, which sums up to around 800ms end-to-end RTT between two clients.
Note: MongoDB is used in our examples, and the performance of executing the query in mongo highly depends on the configuration of your database cluster. Reports can be indexed and sharded by fields used for identifications, such as callId, clientId, peerConnectionId, trackId, sfuId, sfuTransportId, etc.
Additionally, MongoDB is not the only choice Observer can forward reports. The variety of possible sinks is growing based on demand – currently, we support Kafka, and AWS Kinesis Data Firehose too.
Cascaded SFU environment

Usually, things just get more interesting in the real world! Let’s go a bit further and use multiple interconnected SFUs. Comparing the scenario of using one SFU the situation has not changed dramatically but extended considerably. What we are missing for an end-to-end RTT here is the RTT between the interconnected SFUs. That is what the sfu-monitor can give us in the observeRTC stack. The sfu-monitor samples the SFU-to-SFU and SFU-to-user transports. The samples can be sent to the observer, where the samples from all SFUs are processed and reports are generated. We need INBOUND_SFU_RTP_PAD and OUTBOUND_SFU_RTP_PAD reports. Reports belonging to the same SFU_RTP_PAD refer to the RTP session identified by the synchronization source. (The “pad” nomenclature may be familiar to those who have worked with GStreamer, like me 😀)
Similar to the reports generated from the samples the client application provides, INBOUND_SFU_RTP_PAD reports hold information about the remote SFU or client counterpart. Pads belonging to transports opened between SFUs are marked with an internal flag in the reports. If the internal flag is true for an inbound RTP pad, then the observer tries to match it with an outbound RTP pad. If that flag is false then the observer tries to match the pad with a client outbound track.
To calculate the end-to-end RTT between a client and a remote client, we need to involve the RTTs of the interconnected SFUs in our calculation process.
The same ObserveRTC full-stack-example repo also has a cascaded SFU end-to-end RTT calculation example. Like before, you can run the Docker examples with
SFU_ANNOUNCED_IP={YOUR LOCAL IP ADDRESS} docker compose -f docker-compose-cascaded-sfus.yaml up
Note the following differences between the cascaded docker-compose YAML and the non-cascaded one:
- there are multiple instances of the
mediasoup_sfuservice - here is an
SFU_PEERSenvironment variable that tells themediasoup_sfuto initiate a piped connection between a peer. WEBPAGE_PORTs are different so different SFUs listen to WebSocket connections from the client on different ports- the
RTCMIN_PORTandRTCMAX_PORTare different for different SFUs.
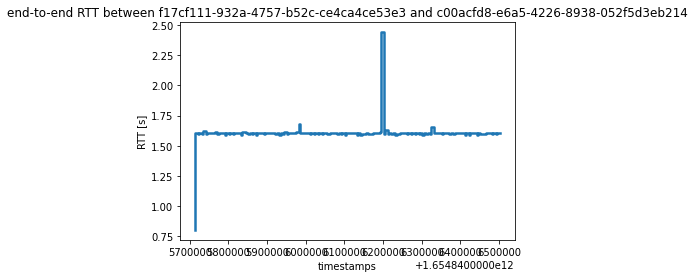
From the webpage part to connect to different SFUs you need to use http://localhost:9000?sfuPort=5959 and http://localhost:9000?sfuPort=7171 where the sfuPort is equal to the WEBSOCKET_PORT you assigned to the different SFUs. A notebook created for this purpose runs here in the Docker example. If you run each cell in that notebook for your CALL_ID and CLIENT_ID, you should see something like this plotted at the end:
Closing words
Now you should have a good understanding of how to measure end-to-end RTT. Hopefully, you also have a better understanding of how open source projects ObserveRTC can be used in conjunction with WebRTC’s getStats for analyzing and troubleshooting WebRTC calls. The ObserveRTC roadmap includes monitoring TURN services, upgrading the In-memory Database Grid, and cloud integrations. Contributions are very welcome :). Happy WebRTC Hacking!
{“author”: “Balázs Kreith“}


Great article. Thank you Balázs for laying out this quite complex topic. It took me quite a while to understand the complexity. I tried WebRTC and it is a great tool to get some insight into WebRTC metrics. Good job.
You are welcome, Bernd! 🙂